BOSS PERFORMANCE GUIDE
Daily Operations (For BOSS)
In the era of refined TikTok e-commerce operations, data-driven decisions are essential. HuaYoung TK is not just a creator outreach tool — it is a complete creator marketing decision and management system that covers the full chain of creator marketing operations. With HuaYoung TK's powerful performance analysis, you can:
- Quantify outcomes:Clearly understand the actual contribution of every store, every creator, and every BD.
- Optimize resource allocation:Identify high-value creators and high-performing BDs, and focus resources on your core strengths.
- Boost team efficiency:Build a fair, transparent performance evaluation system that motivates continuous improvement.
- Drive business growth:Use data insights to design more precise operating strategies.
Operations Overview — Take the Wheel of Your Business Cockpit
Goal
Key metrics
- •Store dashboard: partner creators, converting creators, videos, livestreams, sample requests, and fulfillment
- •Creator GMV tiering: GMV share and structural health
- •Ad analysis: campaign cost, GMV, orders, ROI, and relative averages
- •Product analysis: 4-quadrant view of ad spend vs. product GMV output
- •Video analysis: 4-quadrant view of content retention vs. paid conversion
- 1.1
Store Dashboard
Management advice:
- Select the store and reporting period, then review collaborating creators, converting creators, and conversion rate first
- Then review sample fulfillment rate, video conversion rate, and livestream conversion rate
- If a metric is clearly low, drill into the relevant Creator, Samples, or Content module for the underlying details
- Check whether growth in creators, sample requests, and content is actually producing more converting creators, converting content, and GMV
The Store Dashboard is the visual operations board for each store. It brings creator collaboration and commerce performance into one view.
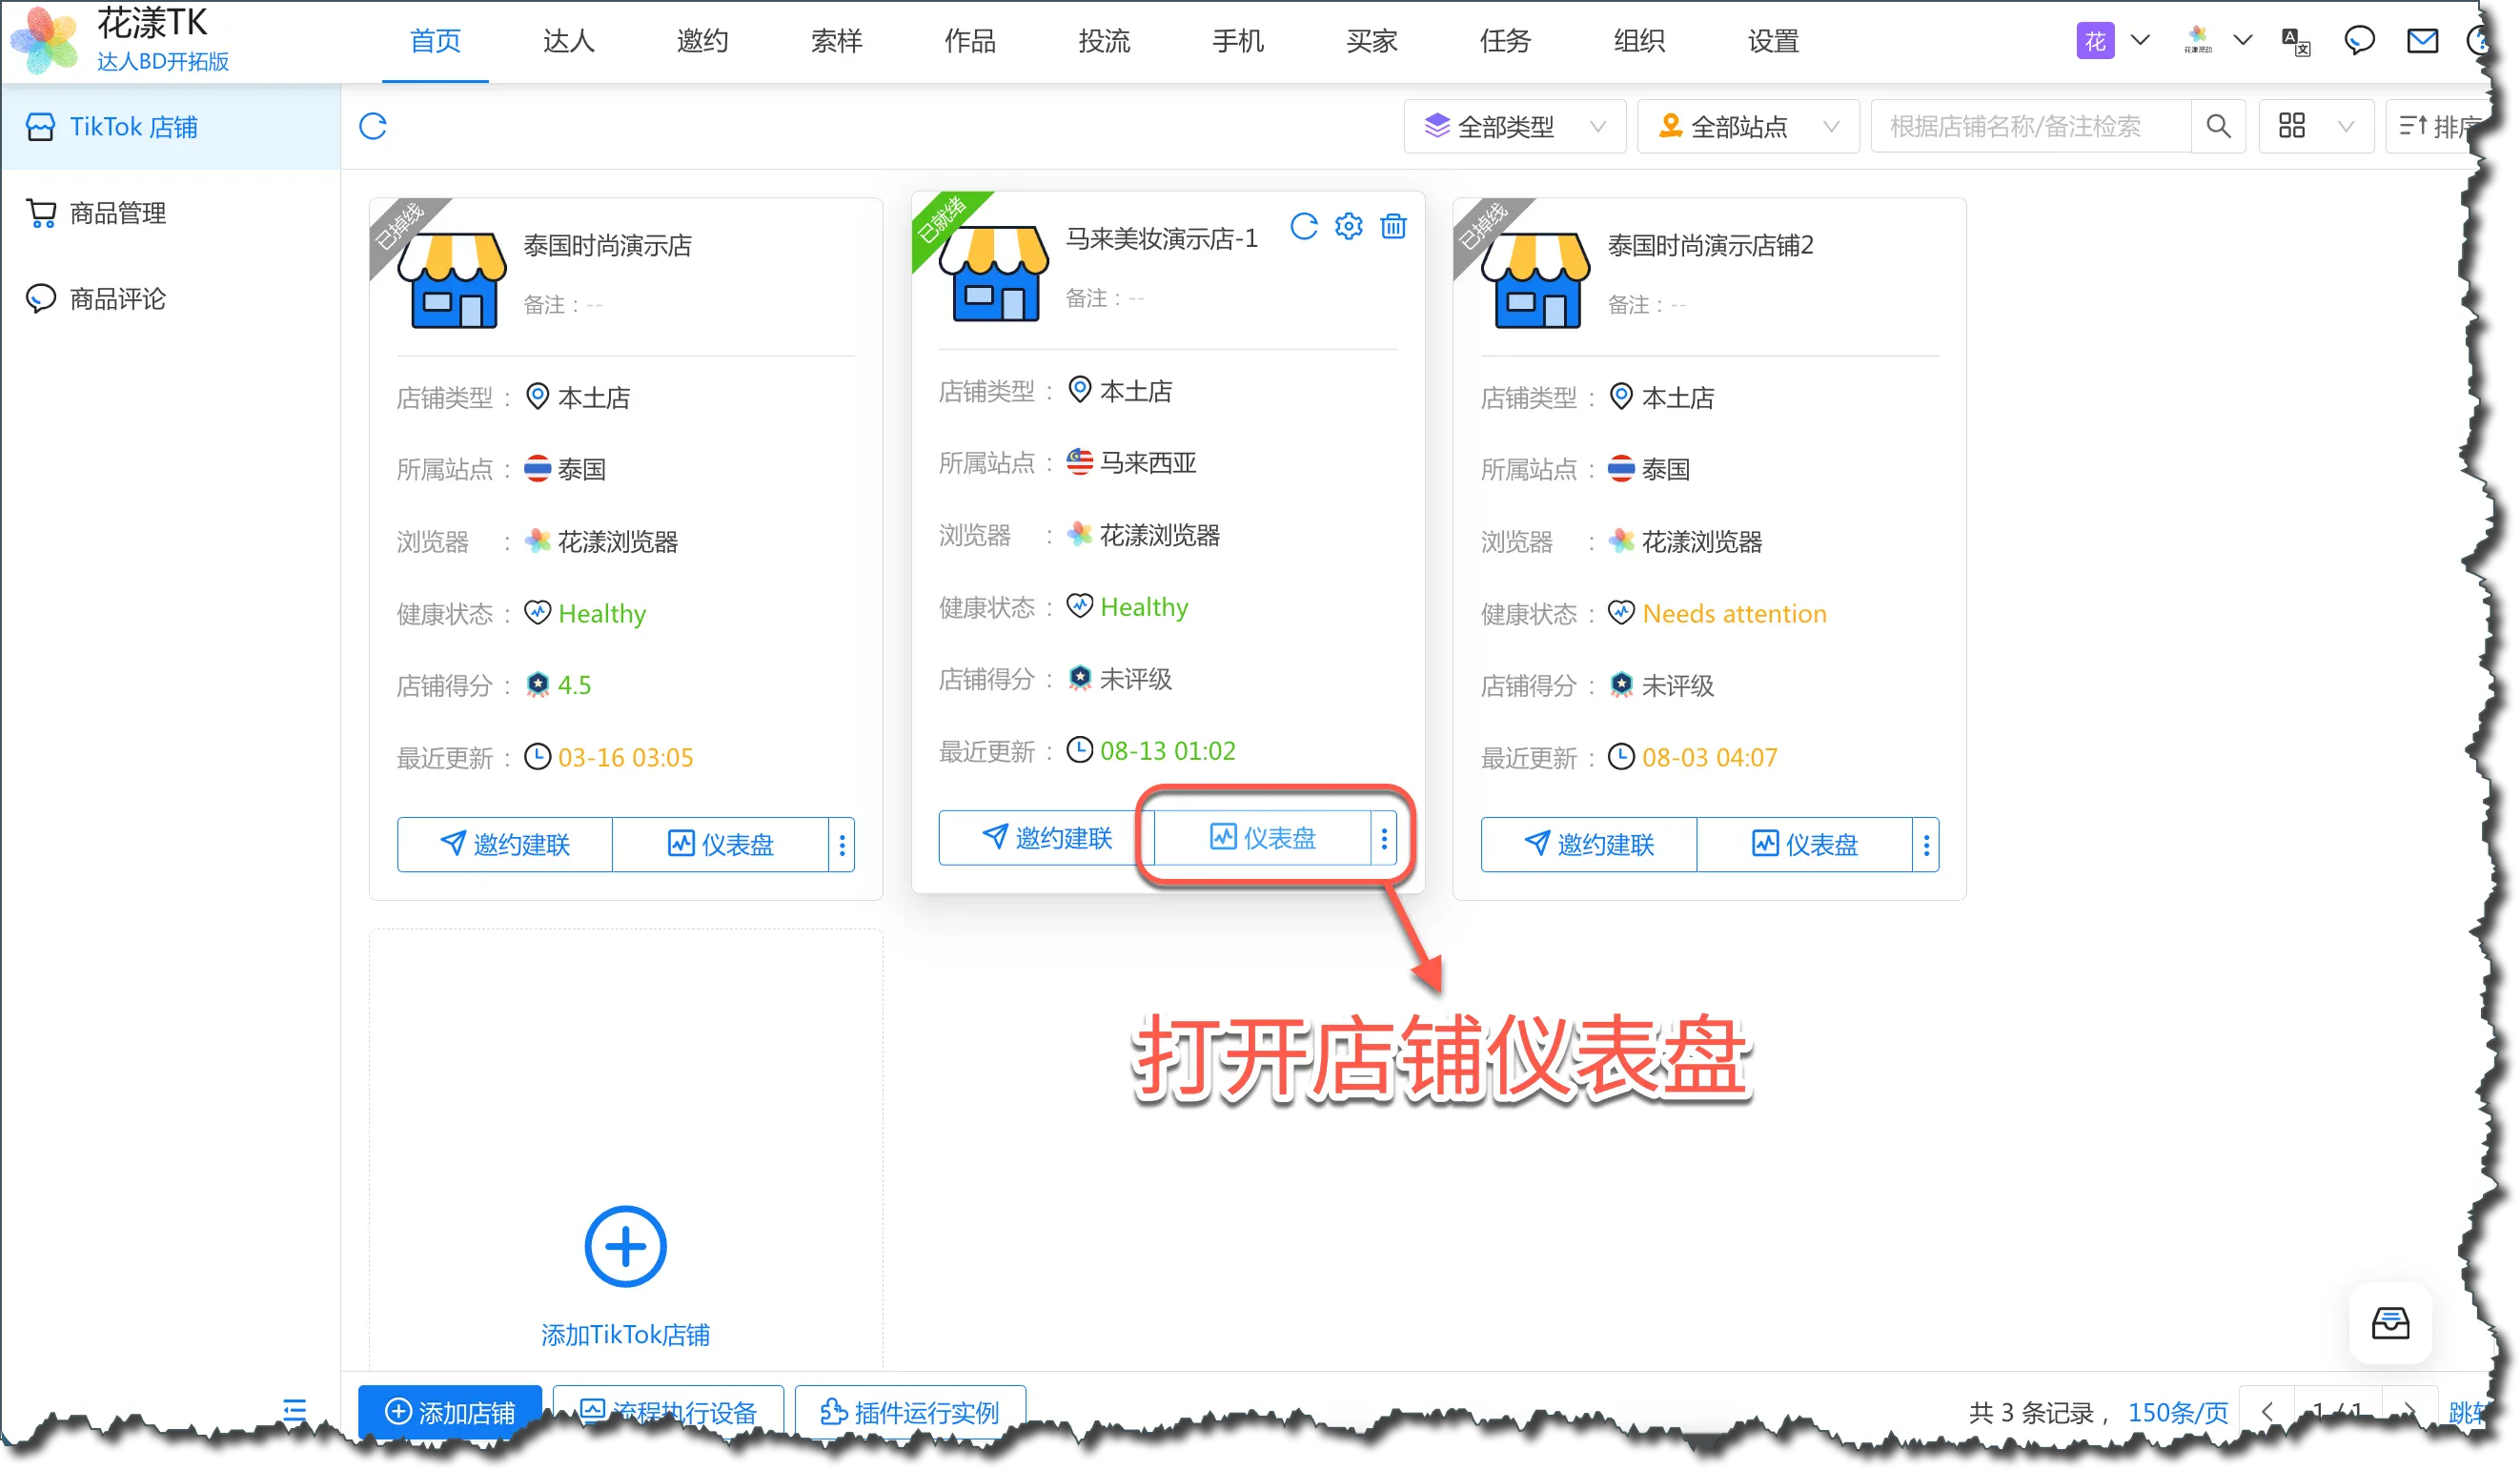
Open Store Dashboard Use it to monitor the operational picture in real time, including creator activity and selling performance.
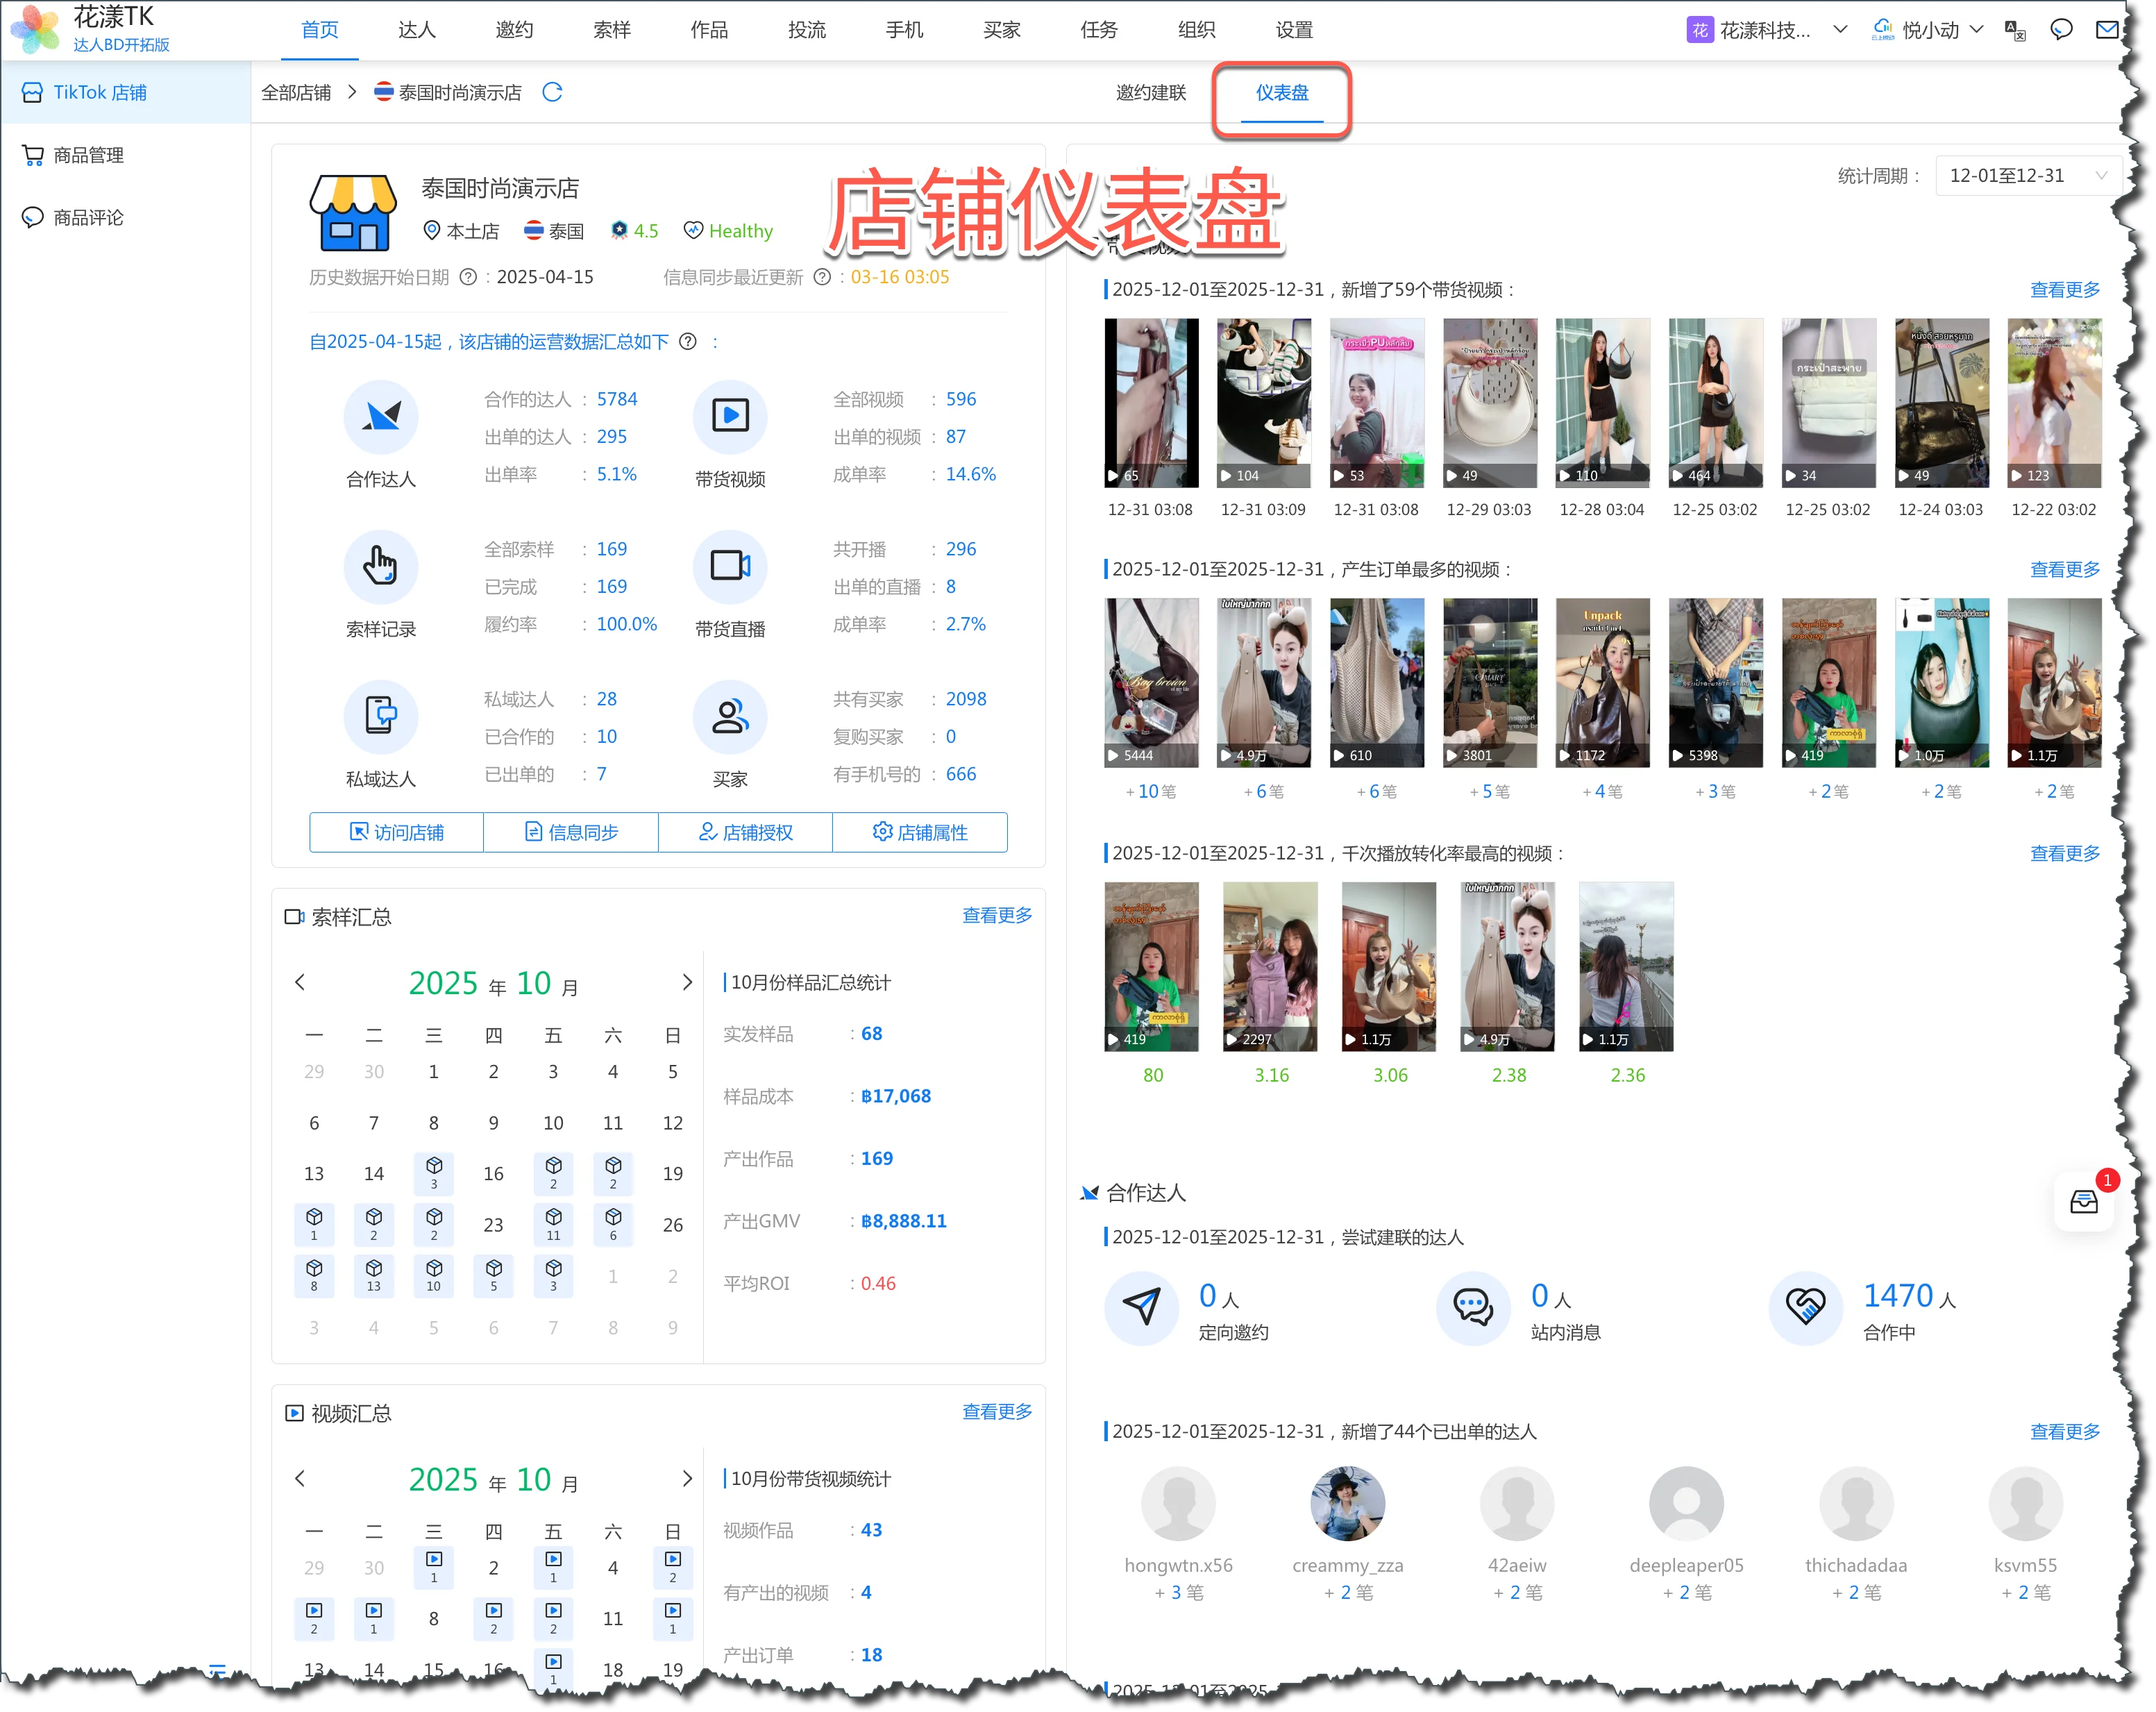
Store operations dashboard Main data displayed:
- Collaborating creators:active collaborators, newly added creators, and creator activity.
- Shoppable videos:creator video volume, views, likes, and related media metrics.
- Shoppable livestreams:livestream sessions, viewers, and conversion data.
- Orders:creator-attributed orders and GMV.
- Ad creatives:creative performance when the store has an ad account.
- Operating trends:changes such as new creators and fastest-growing videos in the last 30 days.
- 1.2
Creator Mix Structure
Bucket creators by GMV range and aggregate the data to reveal the store's creator ecosystem. This helps you judge whether your creator asset structure is healthy.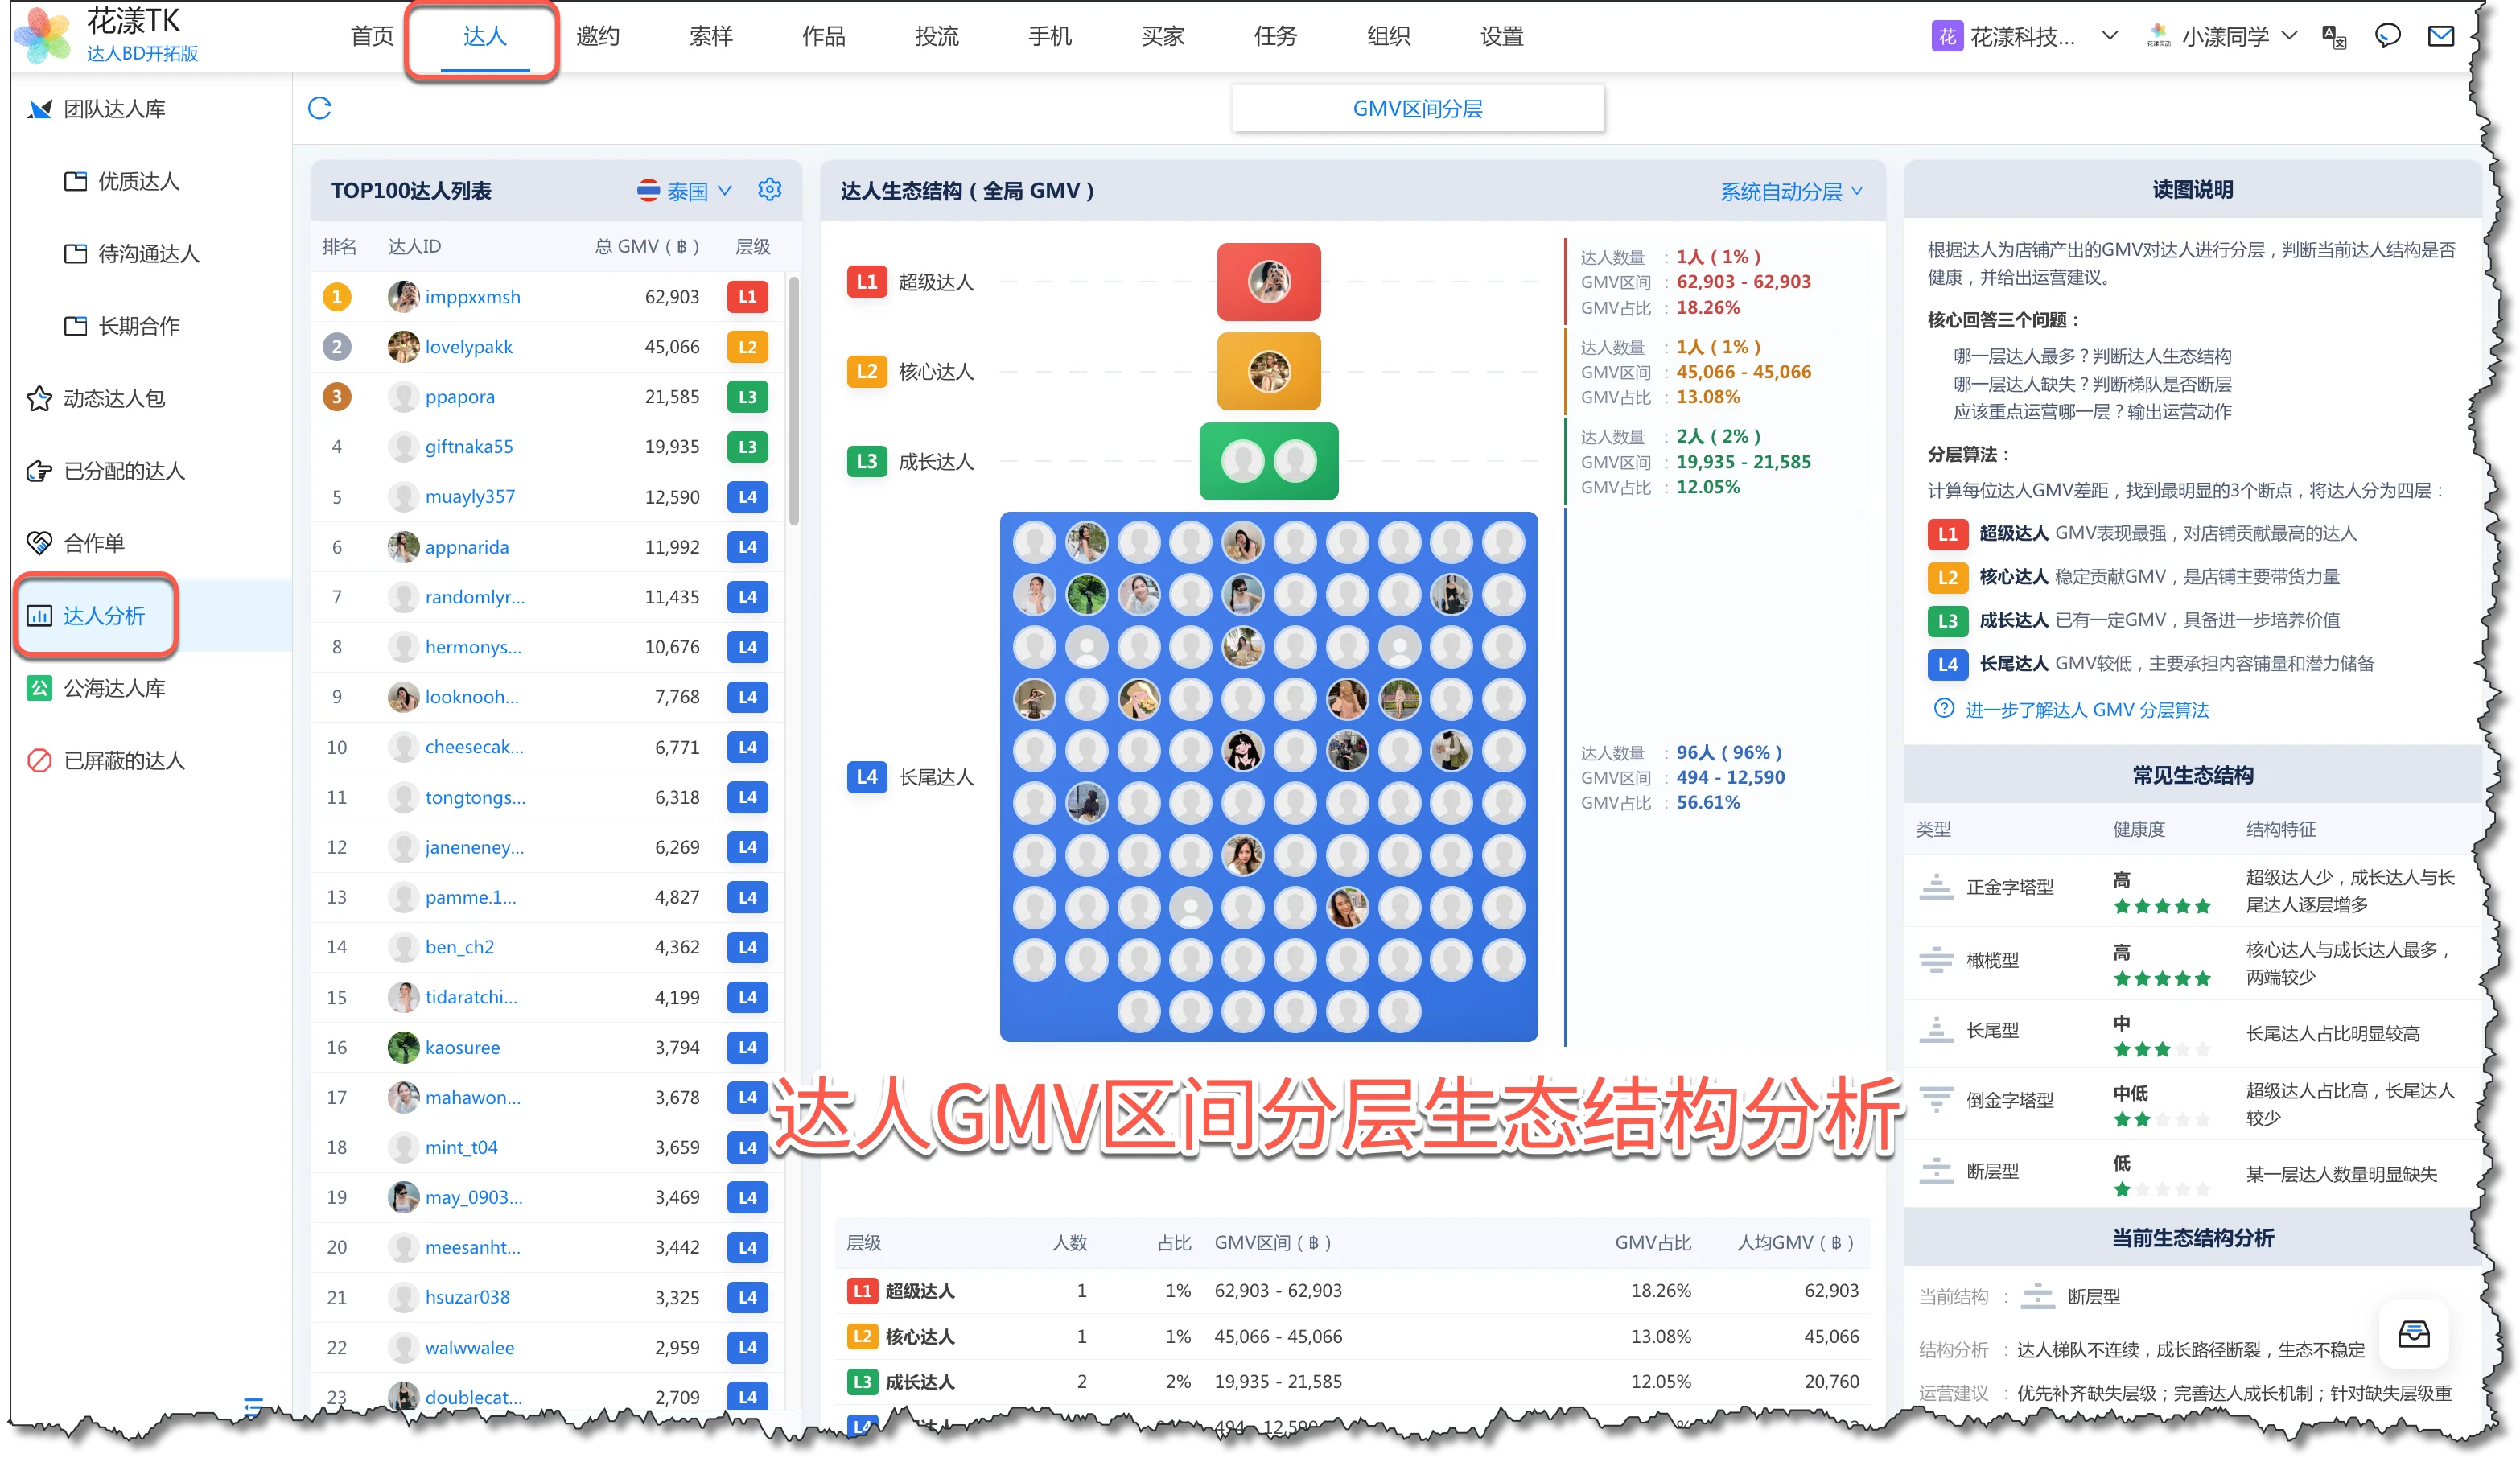
Creator GMV tier distribution analysis Common creator-mix structures:
- Upright pyramid:few top creators, with progressively more growth and long-tail creators. Health: high.
- Olive:the largest groups are core and growth creators, with fewer at both ends. Health: high.
- Long tail:long-tail creators make up a notably large share. Health: medium.
- Inverted pyramid:top creators account for a large share and long-tail creators are few. Health: medium-low.
- Gap structure:one creator tier is materially missing. Health: low.
- 1.3
Ad performance analysis
Ad performance analysis breaks down whether ad spend is paying off at the level of creatives, campaigns, and budgets—giving the BOSS data-driven decisions and the team a shared standard.-
1.3.1 Campaign Analysis
The ad analysis leaderboard lines up each campaign's cost, GMV, orders, ROI, and relative average. Managers can quickly spot high-spend, low-return campaigns—and the ones that deserve more budget.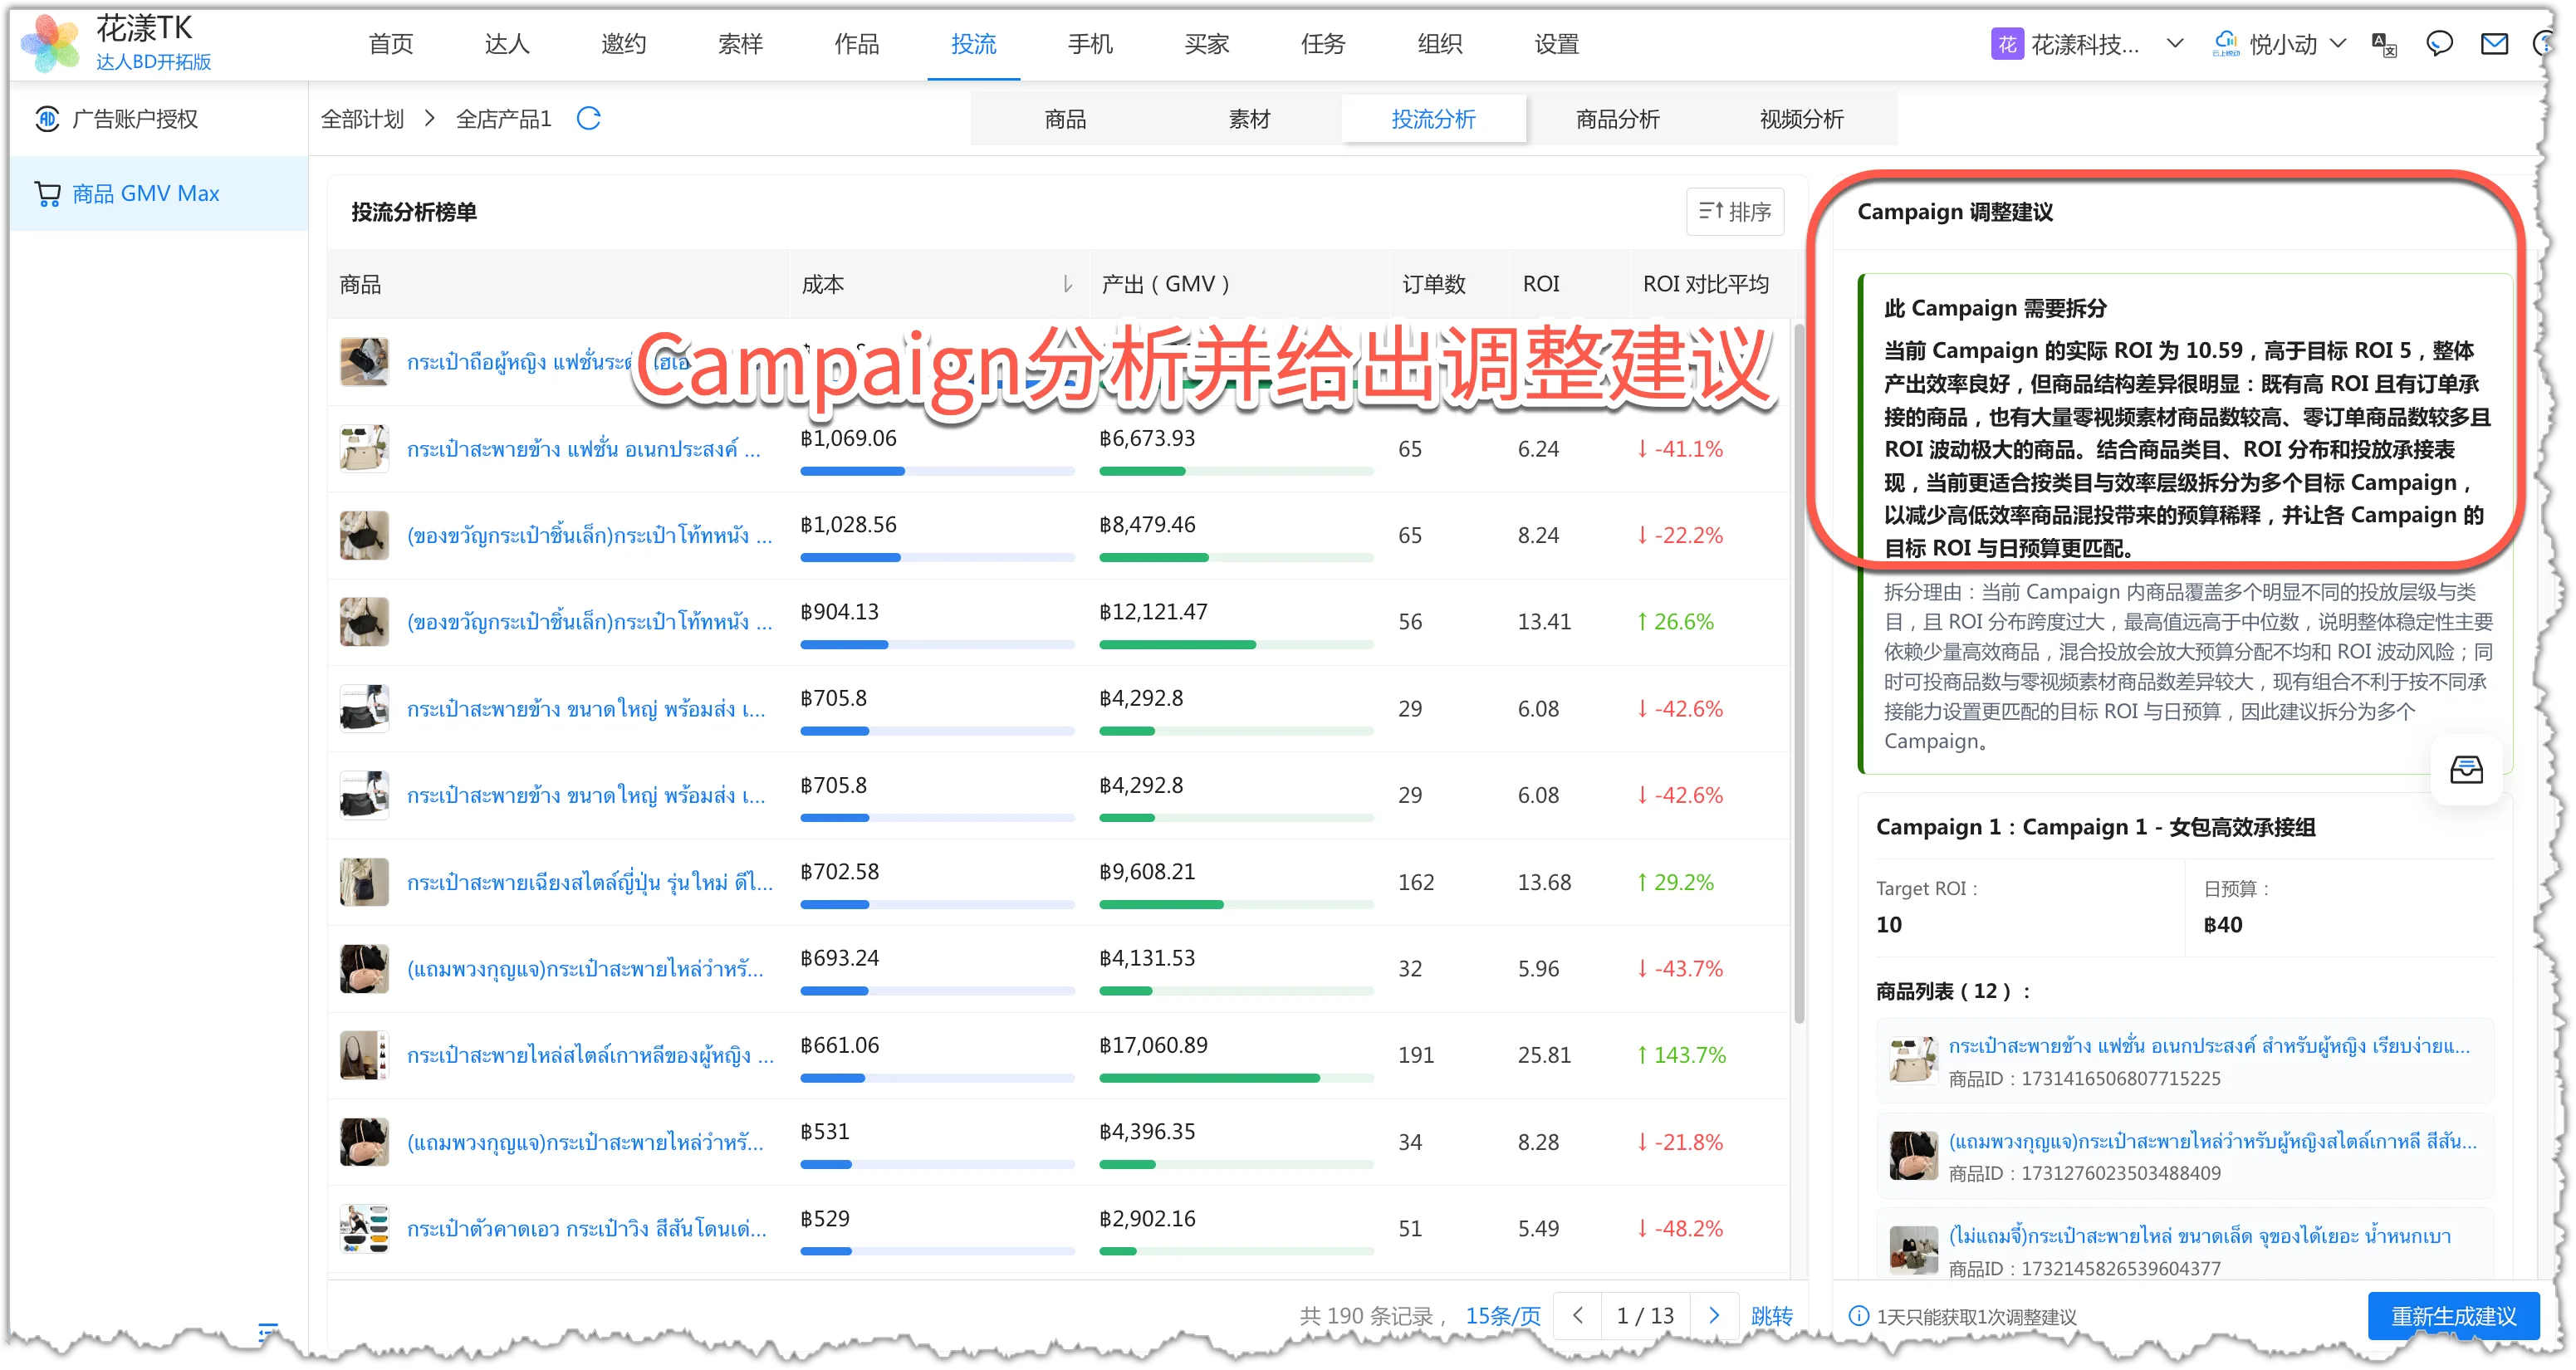
HuaYoung TK ad analysis provides campaign adjustment recommendations Management advice:
- Sort by cost, GMV, or ROI first to surface the campaigns with the biggest impact
- Compare actual ROI, target ROI, and average ROI—don't just chase GMV size
- Use the adjustment suggestions on the right to decide whether to split campaigns, rebalance budget, or swap creatives
- Watch the ROI of high-spend campaigns; an ROI drop can come from a single product or creative, or signal the campaign itself needs to be split and restructured
-
1.3.2 Product Analysis: Find Scaling Products and Cut Inefficient Spend
Product analysis plots ad spend on the X axis and product GMV output on the Y axis, bucketing products into Observe & Test, Inefficient Spend, Potential to Watch, and Core Contributor quadrants.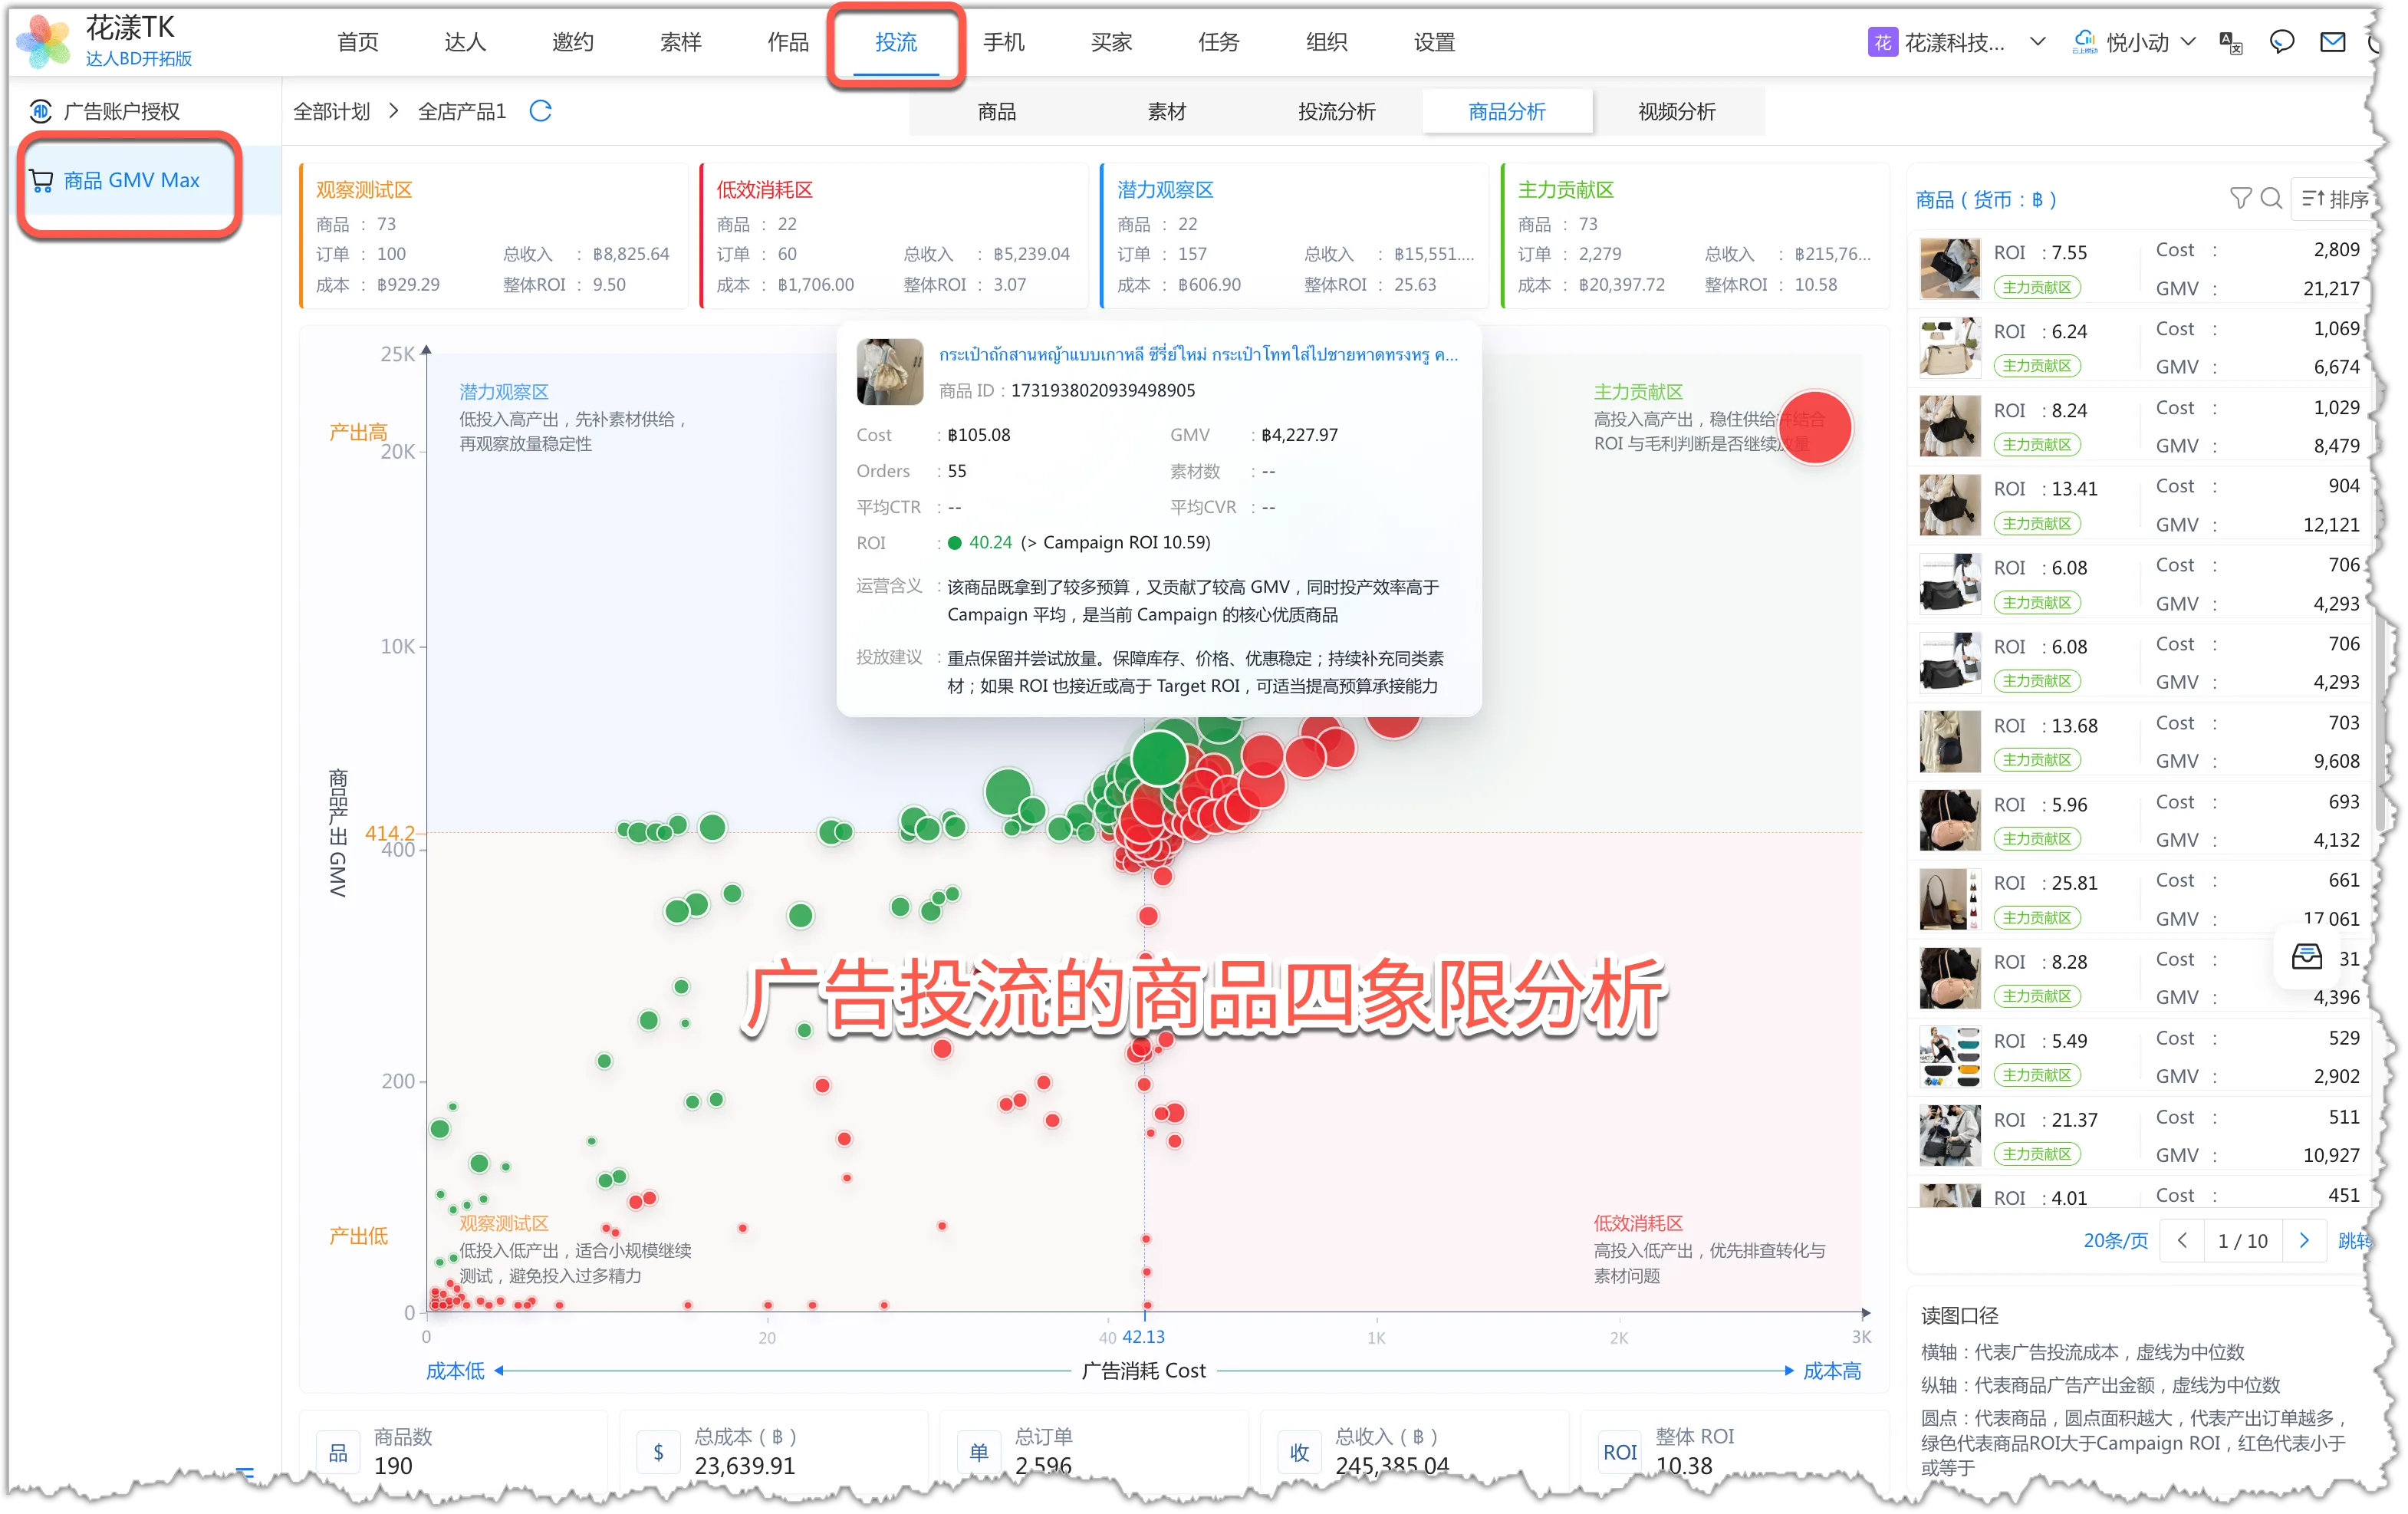
Ad-spend 4-quadrant product analysis - Core contributors:high spend, high output — maintain spend and validate scaling headroom.
- Potential to watch:low spend with output potential — add creatives and run small-budget tests.
- Inefficient spend:high spend, low output — optimize or pause.
- Observe and test:low spend, low output — retain a small test budget and avoid scaling too early.
-
1.3.3 Video Analysis: Tell Content Issues from Conversion Issues
Video analysis uses a content retention index and a paid conversion index to bucket creatives into four groups. Managers can tell whether a video has a content problem, a conversion problem, or is ready to scale.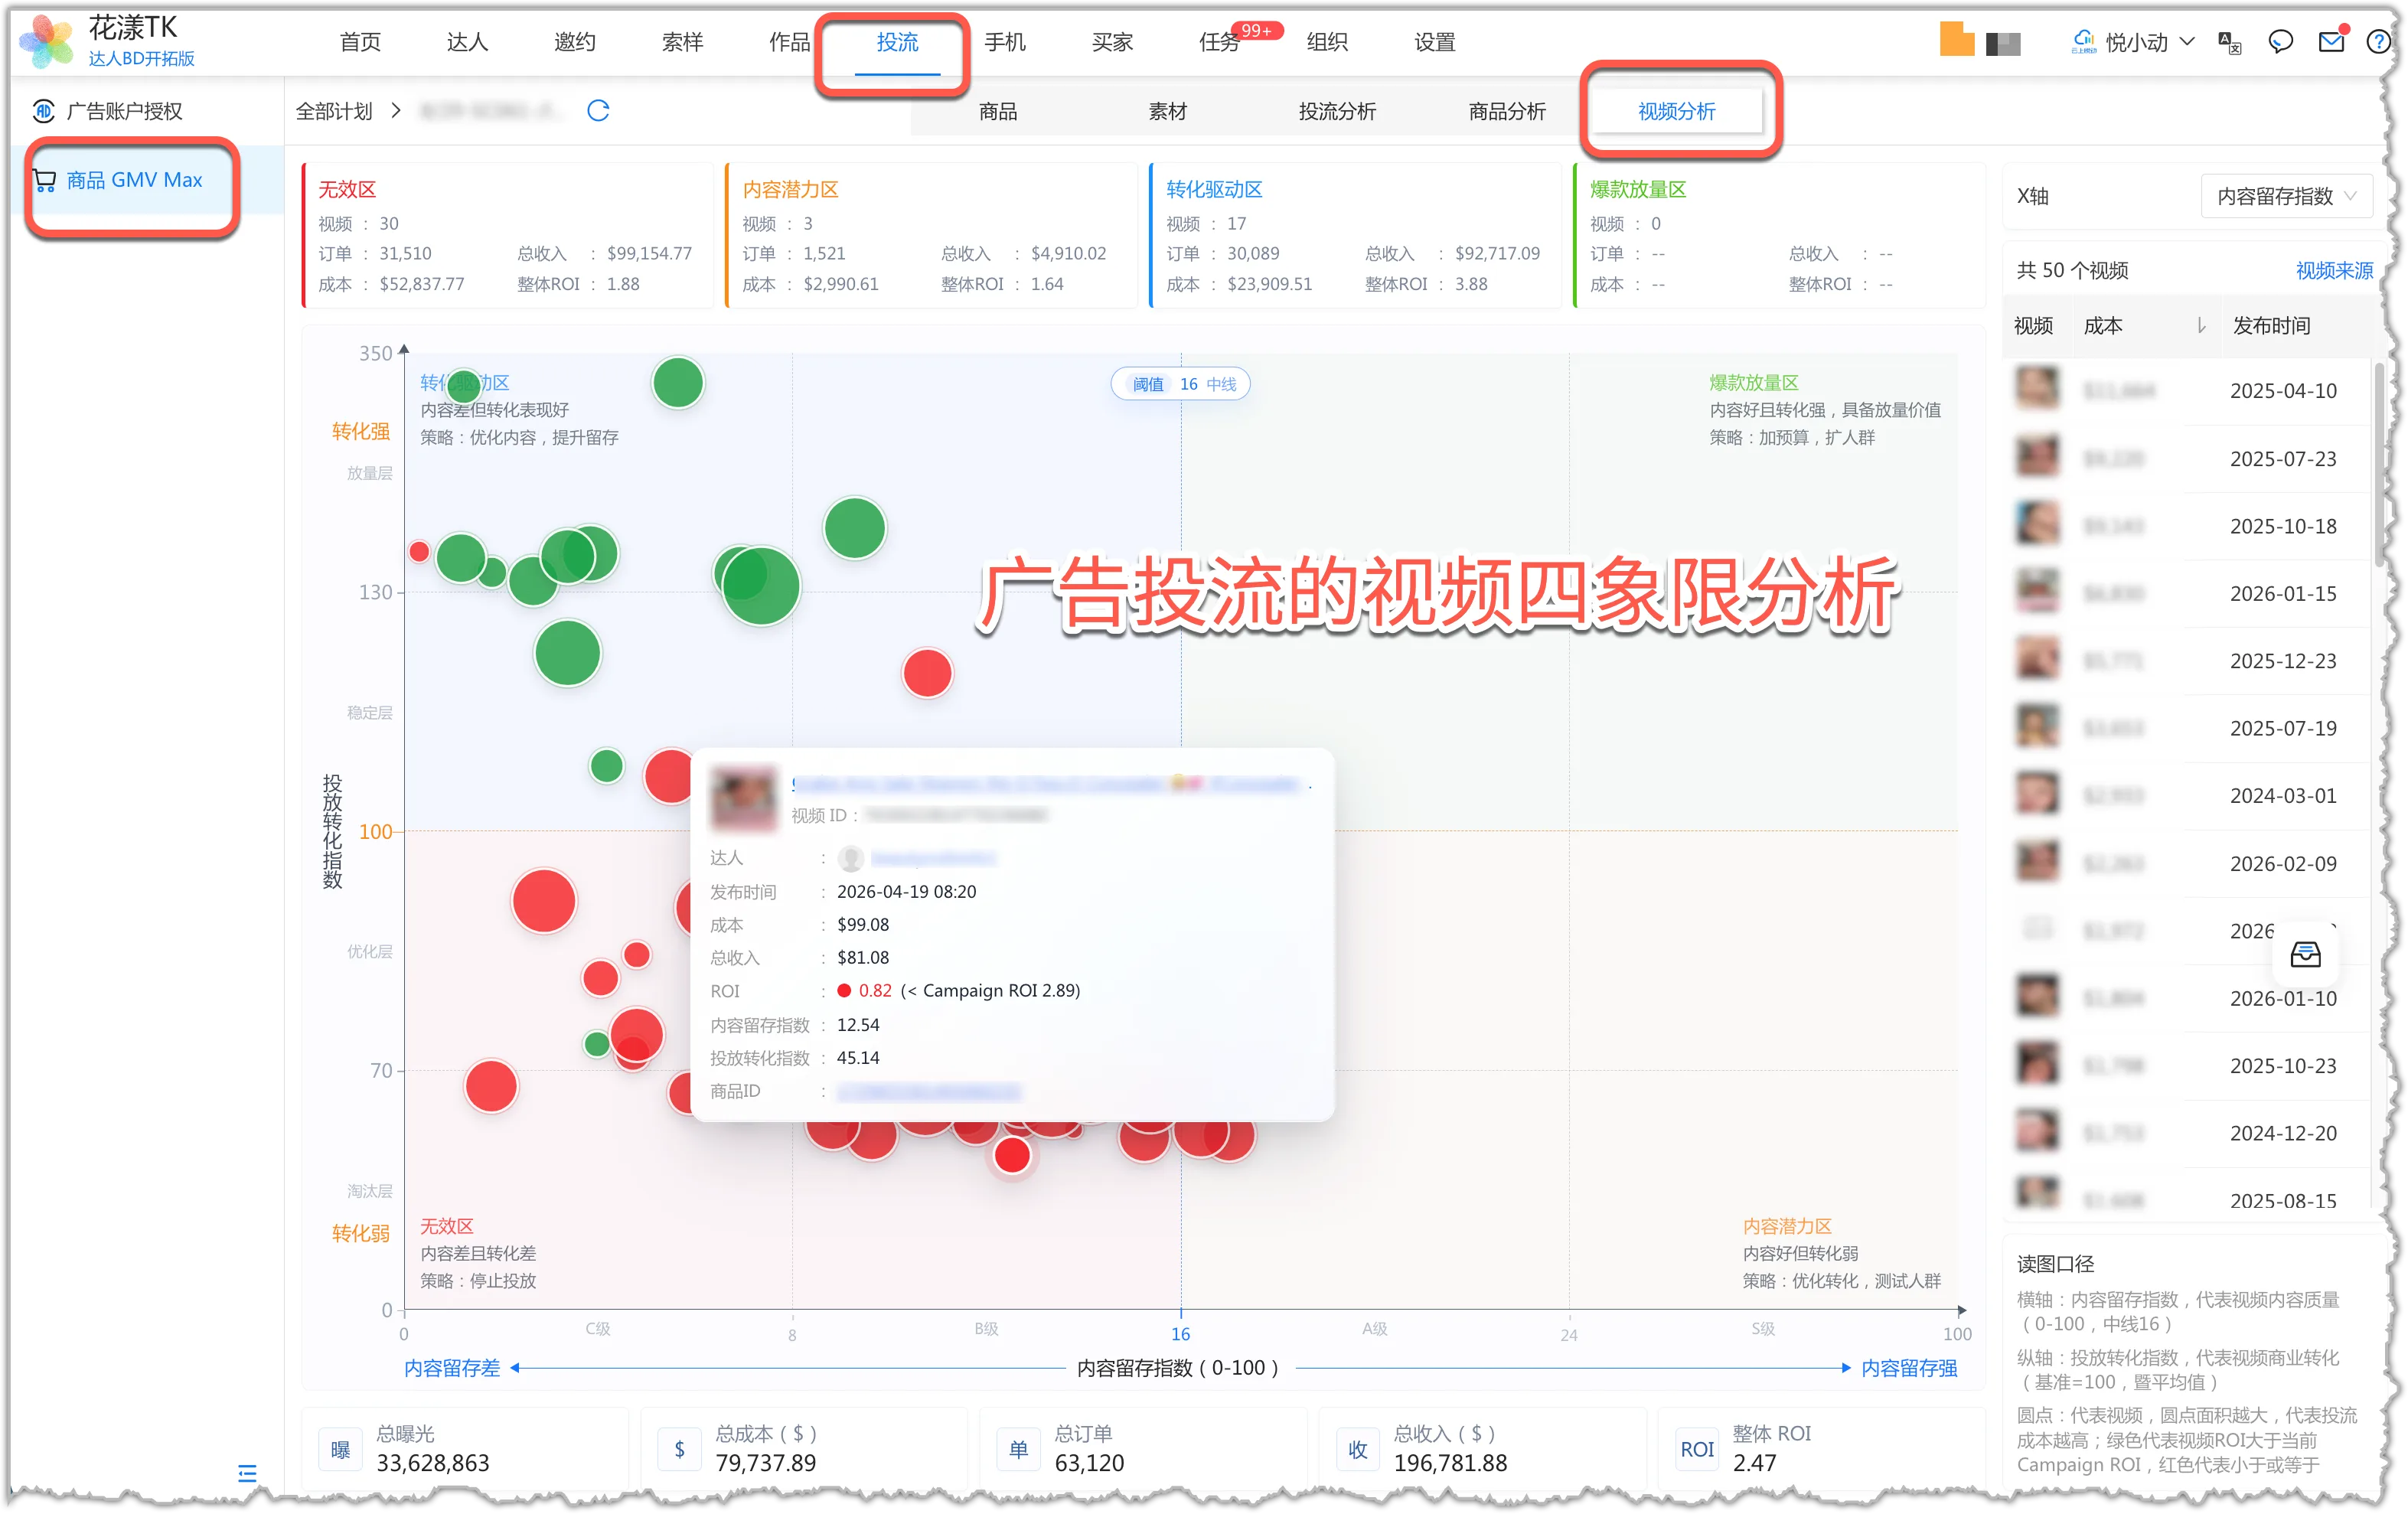
Ad-spend 4-quadrant video analysis - Scale winners:strong content and conversion — increase budget and expand the audience.
- Content potential:strong content, weak conversion — optimize conversion and test audiences.
- Conversion-driven:weak content, strong conversion — improve content and retention.
- Ineffective:weak content and conversion — stop spend.
For more on ad analysis, see
Ad Analysis.
-
Store Performance — Spot the Growth and the Bottlenecks in Your Operating Chain
Goal
Key metrics
- •Cross-store comparison on the same metrics: outreach, samples, content, and performance
- •Outreach, sample requests, shipments, and fulfillment conversion
- •Sample approval rate, fulfillment rate, sample cost, and ROI
- •Videos, livestreams, attributed orders, and content GMV
- •Total store GMV, video-driven GMV, and livestream-driven GMV
- •Daily raw data and Excel export
- 2.1
Multi-store Overview: Find the Store to Drill Into
On the organization-level Store Performance summary, pick a month and currency to compare each store's creator outreach, samples, content, and sales data side by side. Click a store to drill into its creator outreach, sample, and content details.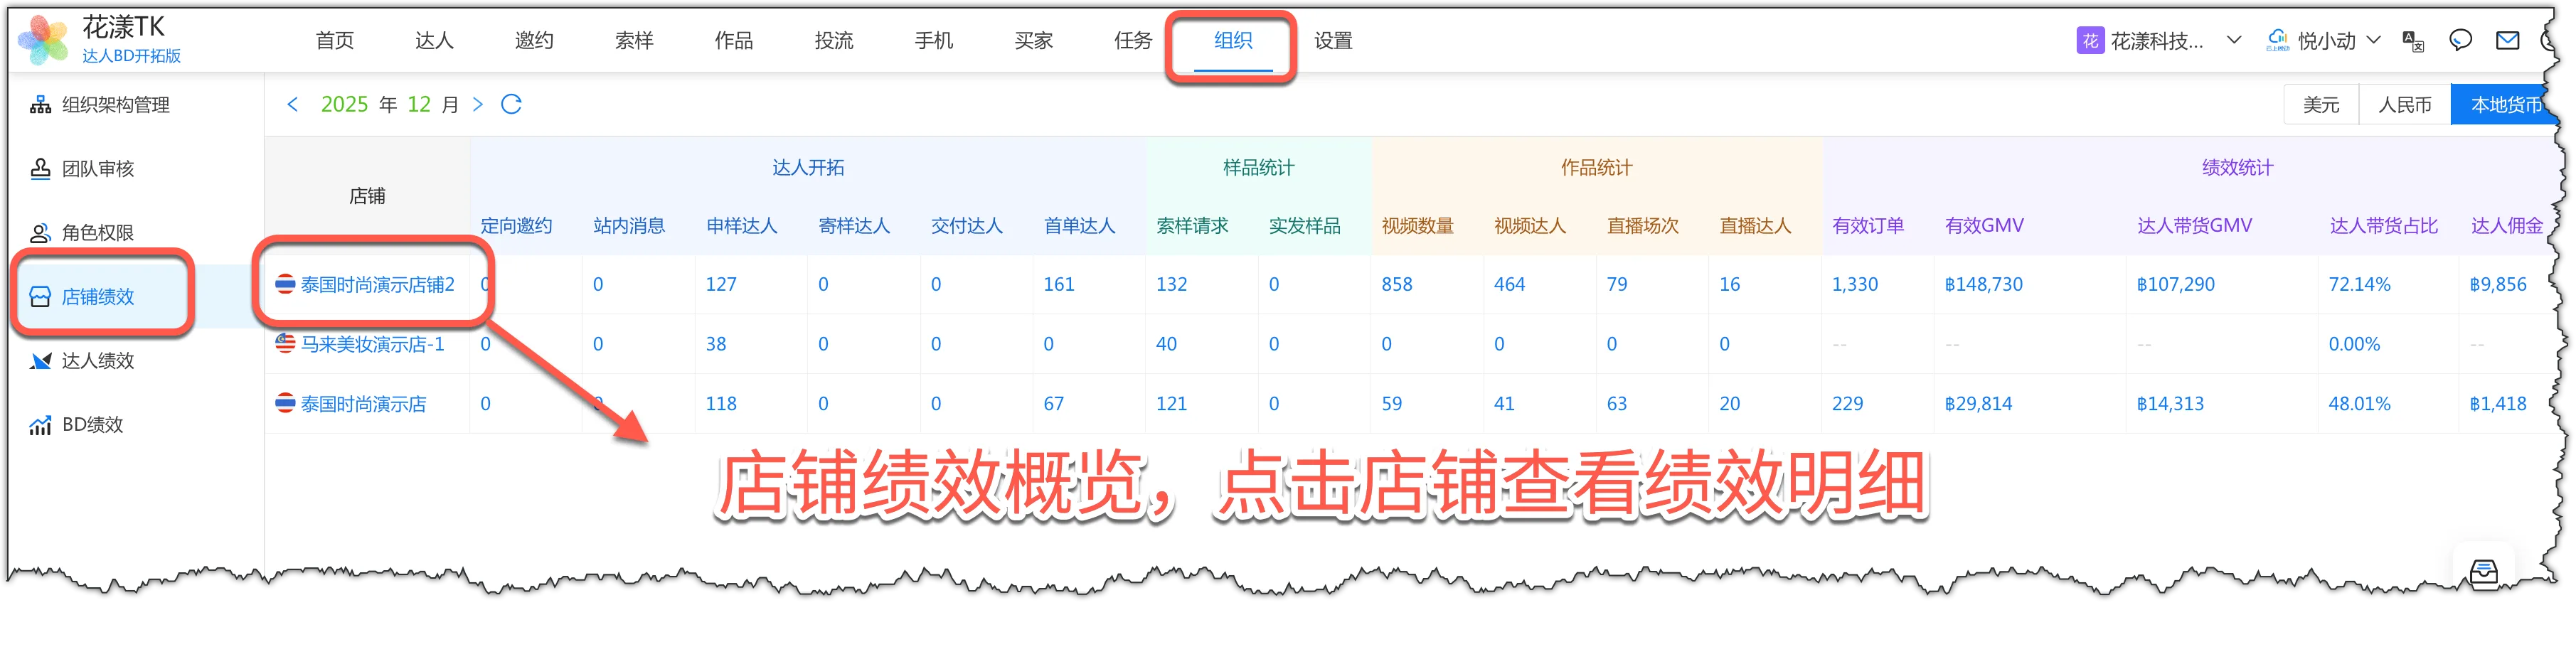
Multi-store performance overview - 2.2
Creator Outreach: Use Trends and Funnels to Find Conversion Wins and Breaks
The store performance detail view shows the store's daily creator outreach trend and the creator outreach funnel. The visual presentation helps managers quickly spot increases or drops in outreach. Distinguish between a one-day batch and sustained, steady outreach, and watch the layer-by-layer conversion from contact to sample request, to shipment, to fulfillment.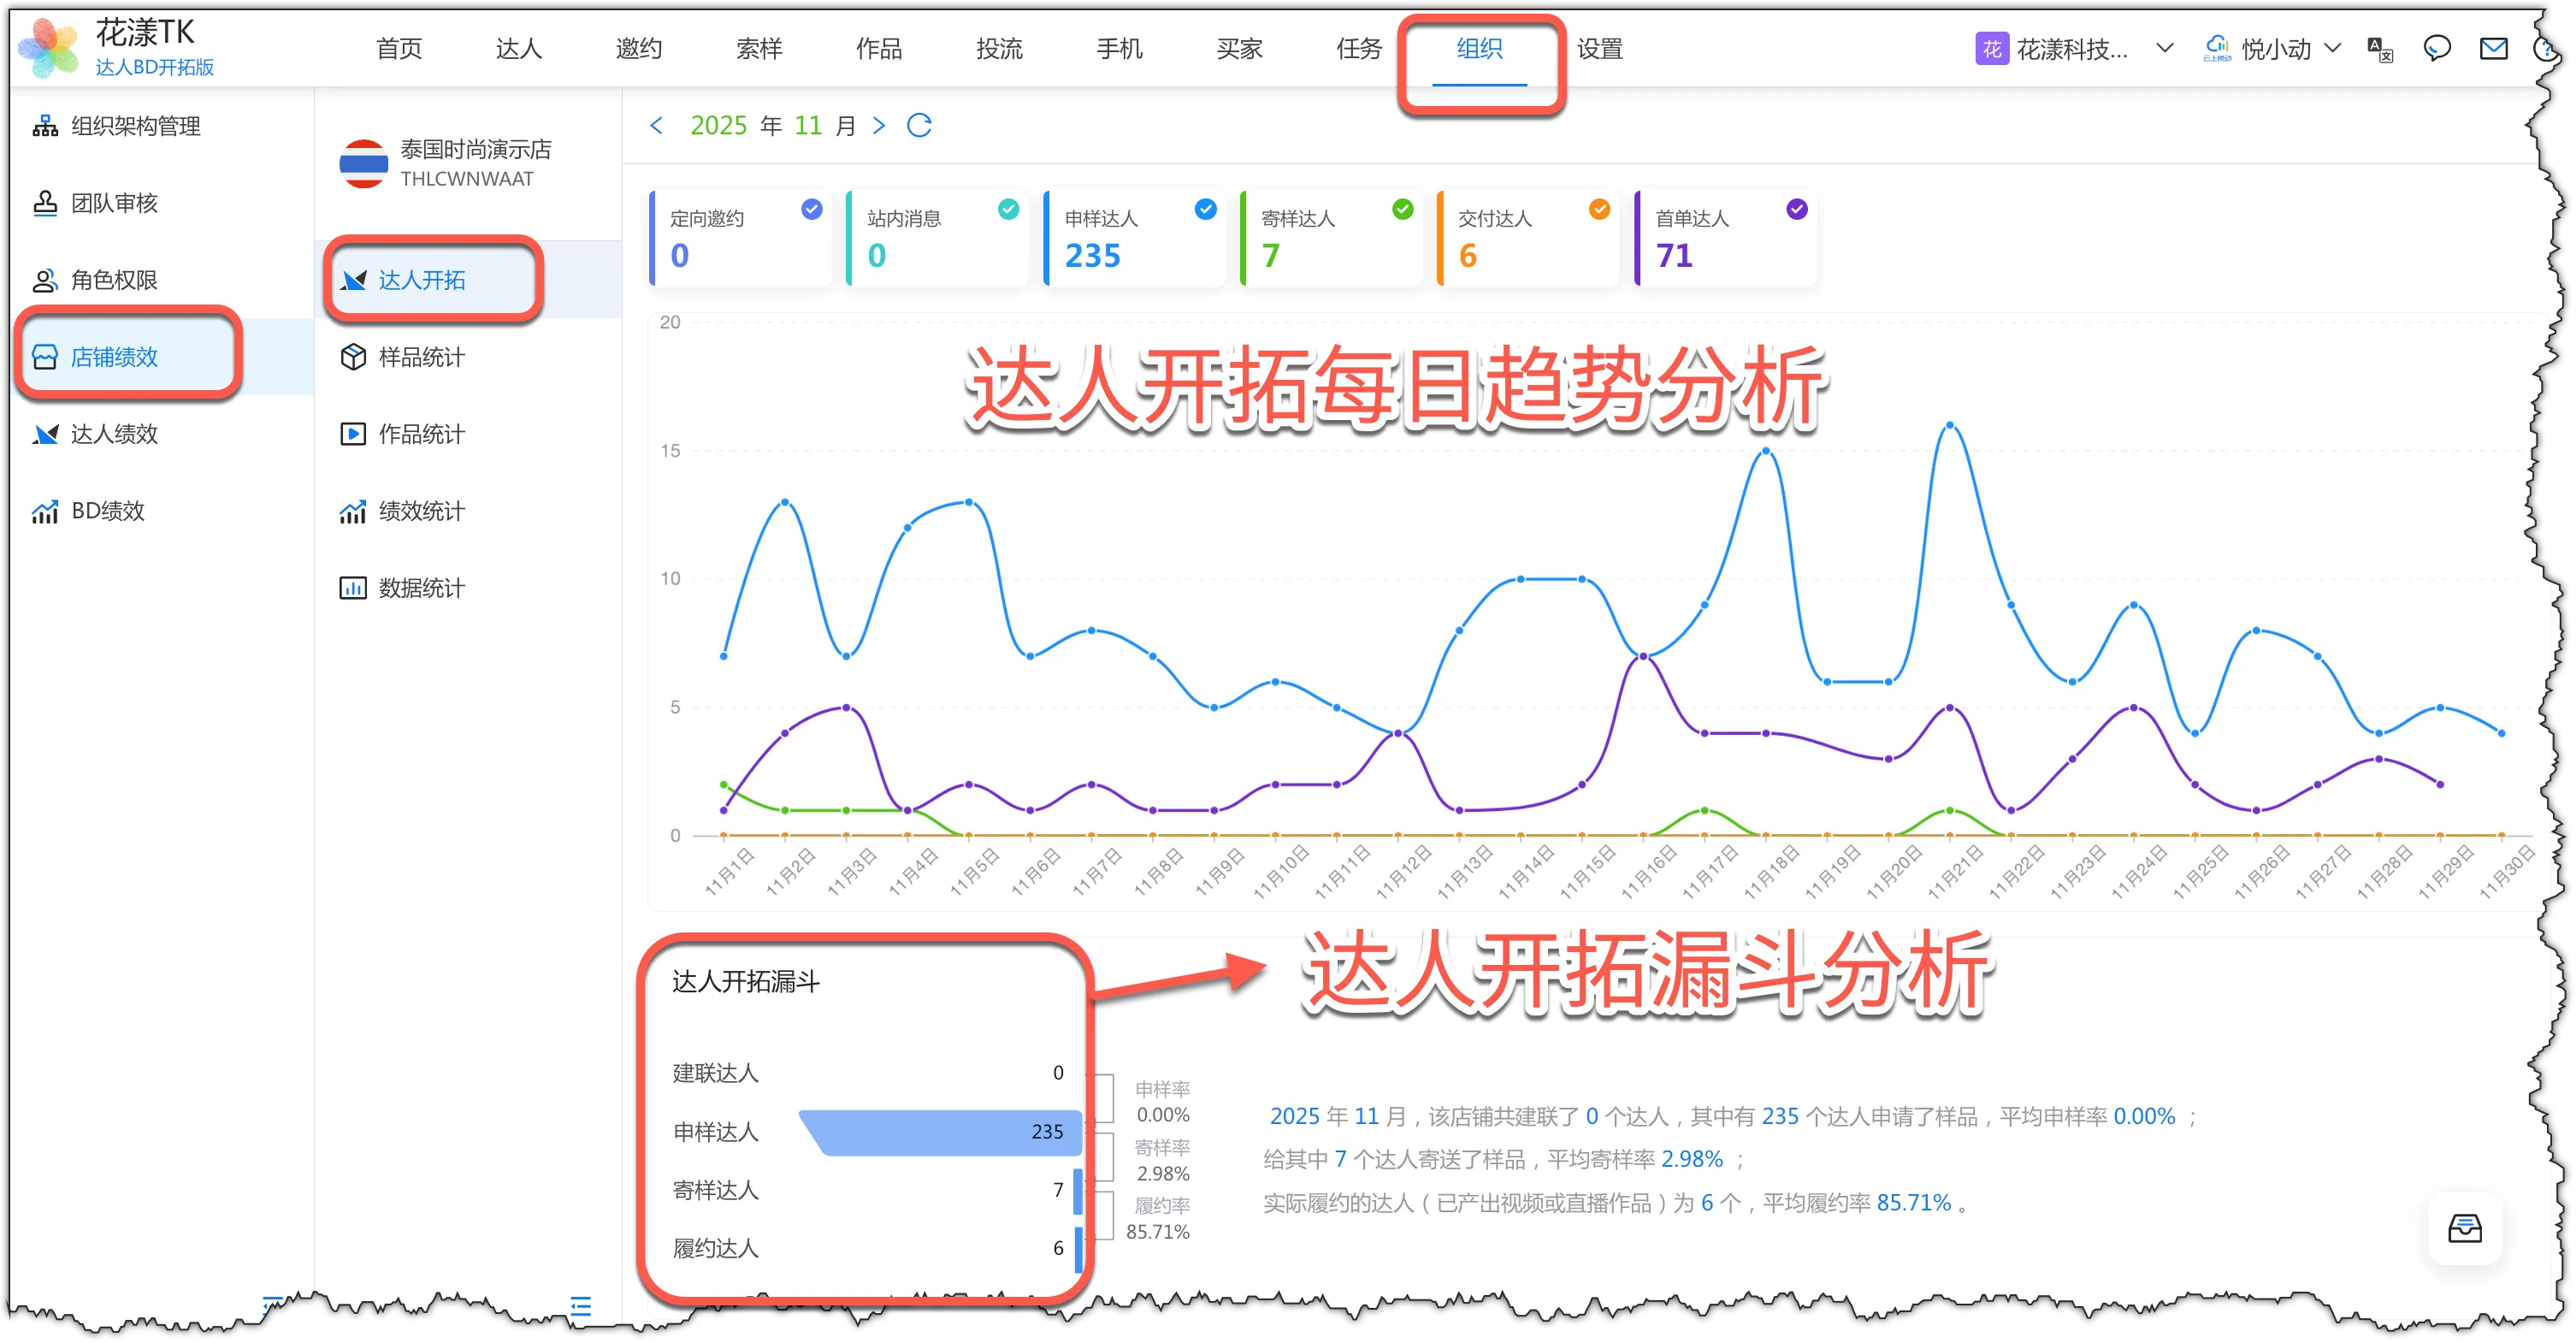
Daily outreach trend and conversion funnel Creator outreach trend analysis and recommended checks:
- Many invitations, few applications:review invitation messaging, product appeal, and creator fit.
- Many samples shipped, few deliveries:review creator quality and fulfillment rate.
- Many deliveries, few first orders:review product fit and content quality.
- Many pieces of content, low GMV:review product fit and content performance.
- 2.3
Sample Statistics: Connect Sample Cost to Fulfillment and Output
The Samples page shows sample requests, shipped samples, content, orders, GMV, cost, and ROI at daily and monthly granularity, and drills into individual samples. It answers the question: "After we shipped the sample, did it produce content and sales?"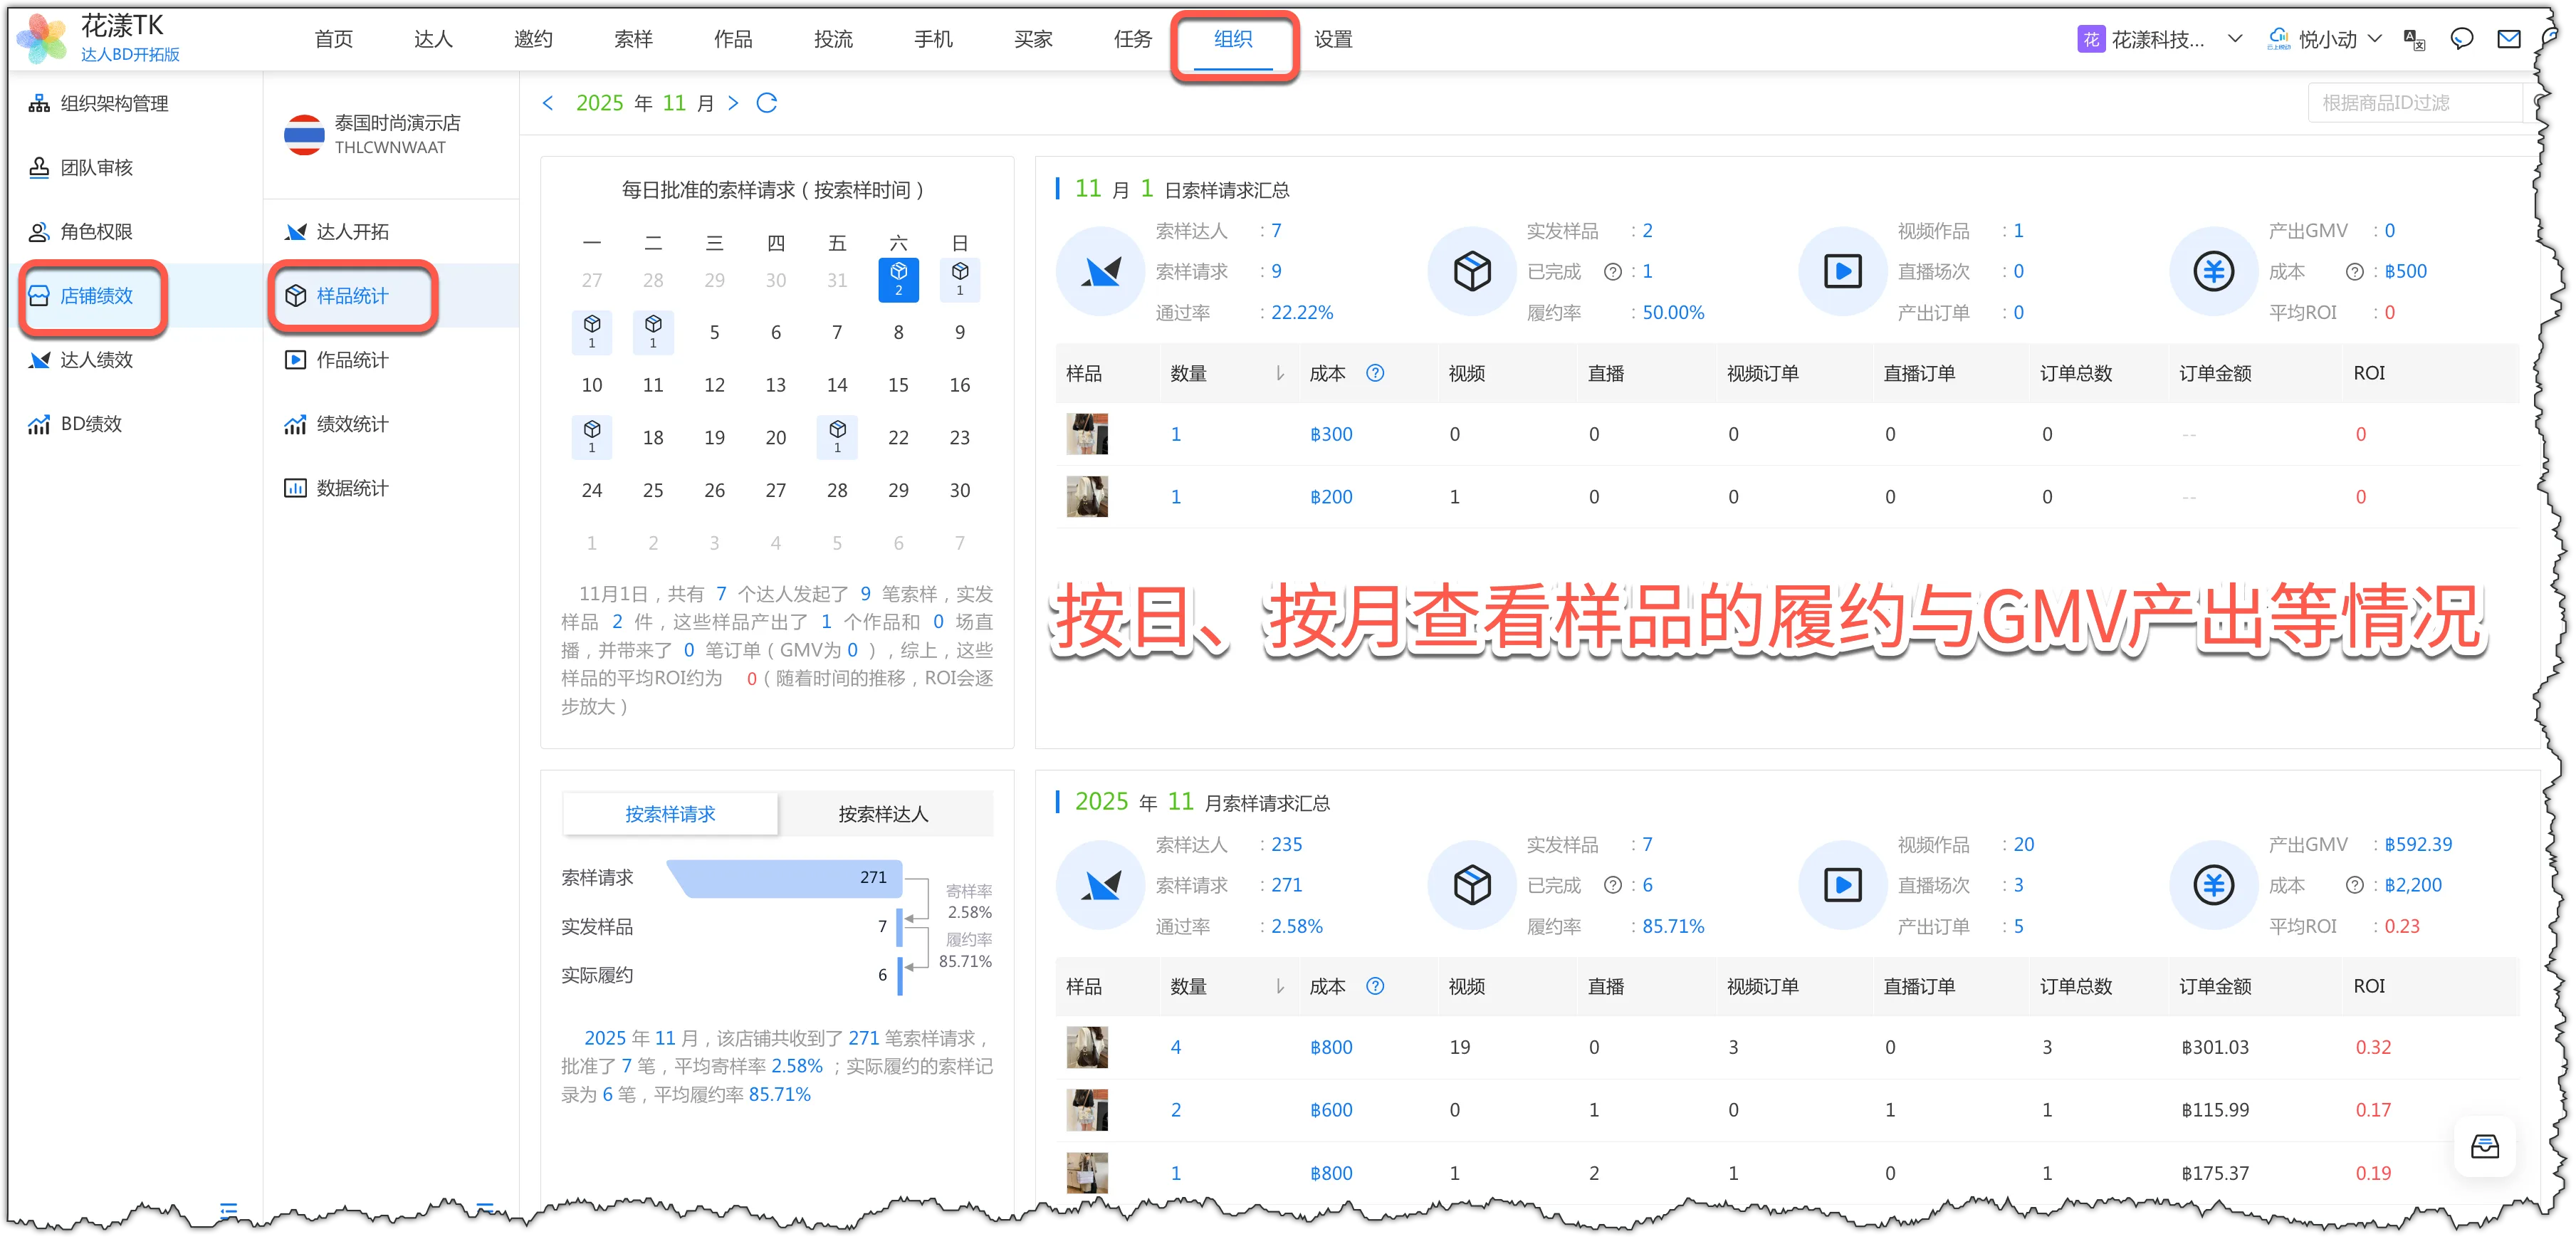
View sample fulfillment and GMV output by day or month Management advice:
- Sample requests and shipped samples:if approval is low, review application quality and approval policy; if shipments are low, review approval execution and fulfillment.
- Shipped samples and fulfillment:low fulfillment means creators have not produced required content; prioritize follow-up with unfulfilled creators.
- Fulfilled samples, content, and sales:when content has no orders, investigate content performance and creator-product fit.
- Sample cost and ROI:drill into creator and product details to improve selection, continue follow-up, or stop similar investment.
- 2.4
Content Statistics: From Publish Count Down to Single-piece Output
Content Statistics shows daily video/livestream details—content, creator, product, views, orders, and GMV. The monthly summary ties creators, productive content, and sales together.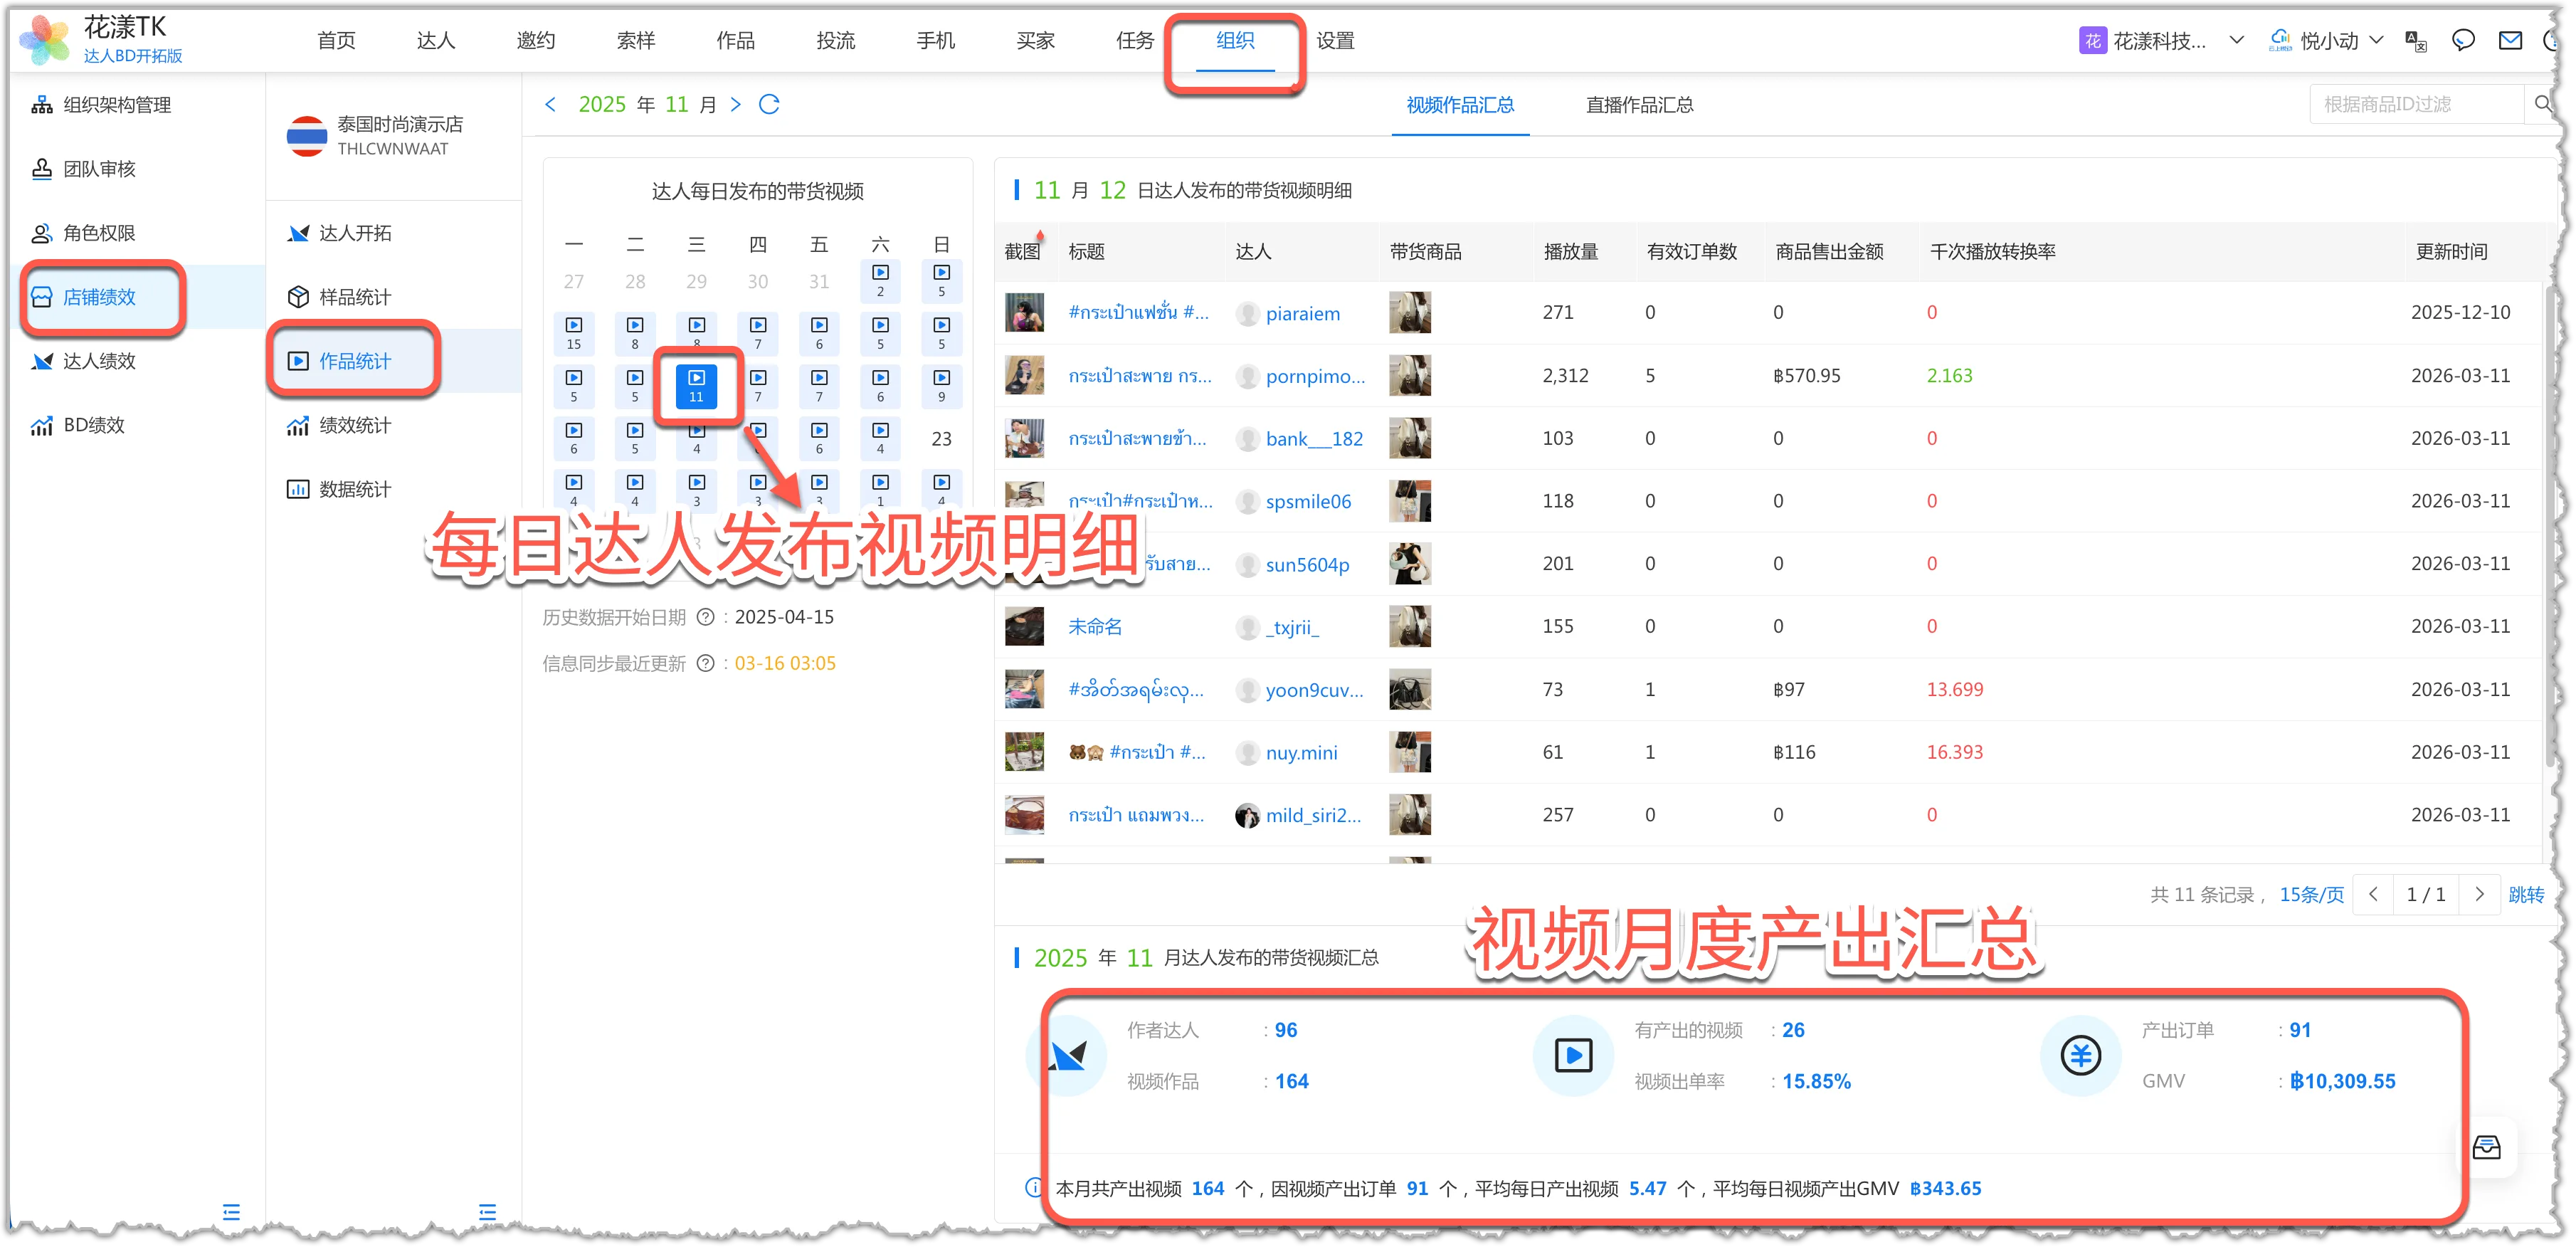
Daily creator content detail and monthly output summary Management advice:
- Review cadence:check publishing cadence in the calendar to confirm continuous content supply.
- Compare volume:compare video/livestream count, productive content, and attributed orders.
- Compare high and low views:use high-view/no-order and low-view/with-order content to identify content and conversion signals.
- Volume and quality:publishing more is not the same as performing better; compare active creators, productive-content share, orders, and GMV before drilling into individual content.
- 2.5
Performance Statistics: GMV from Videos and Livestreams
Performance Statistics overlays daily GMV, video-driven GMV, and livestream-driven GMV in one chart. Beyond monthly totals, look at each channel's share, daily swings, and how they line up with content supply.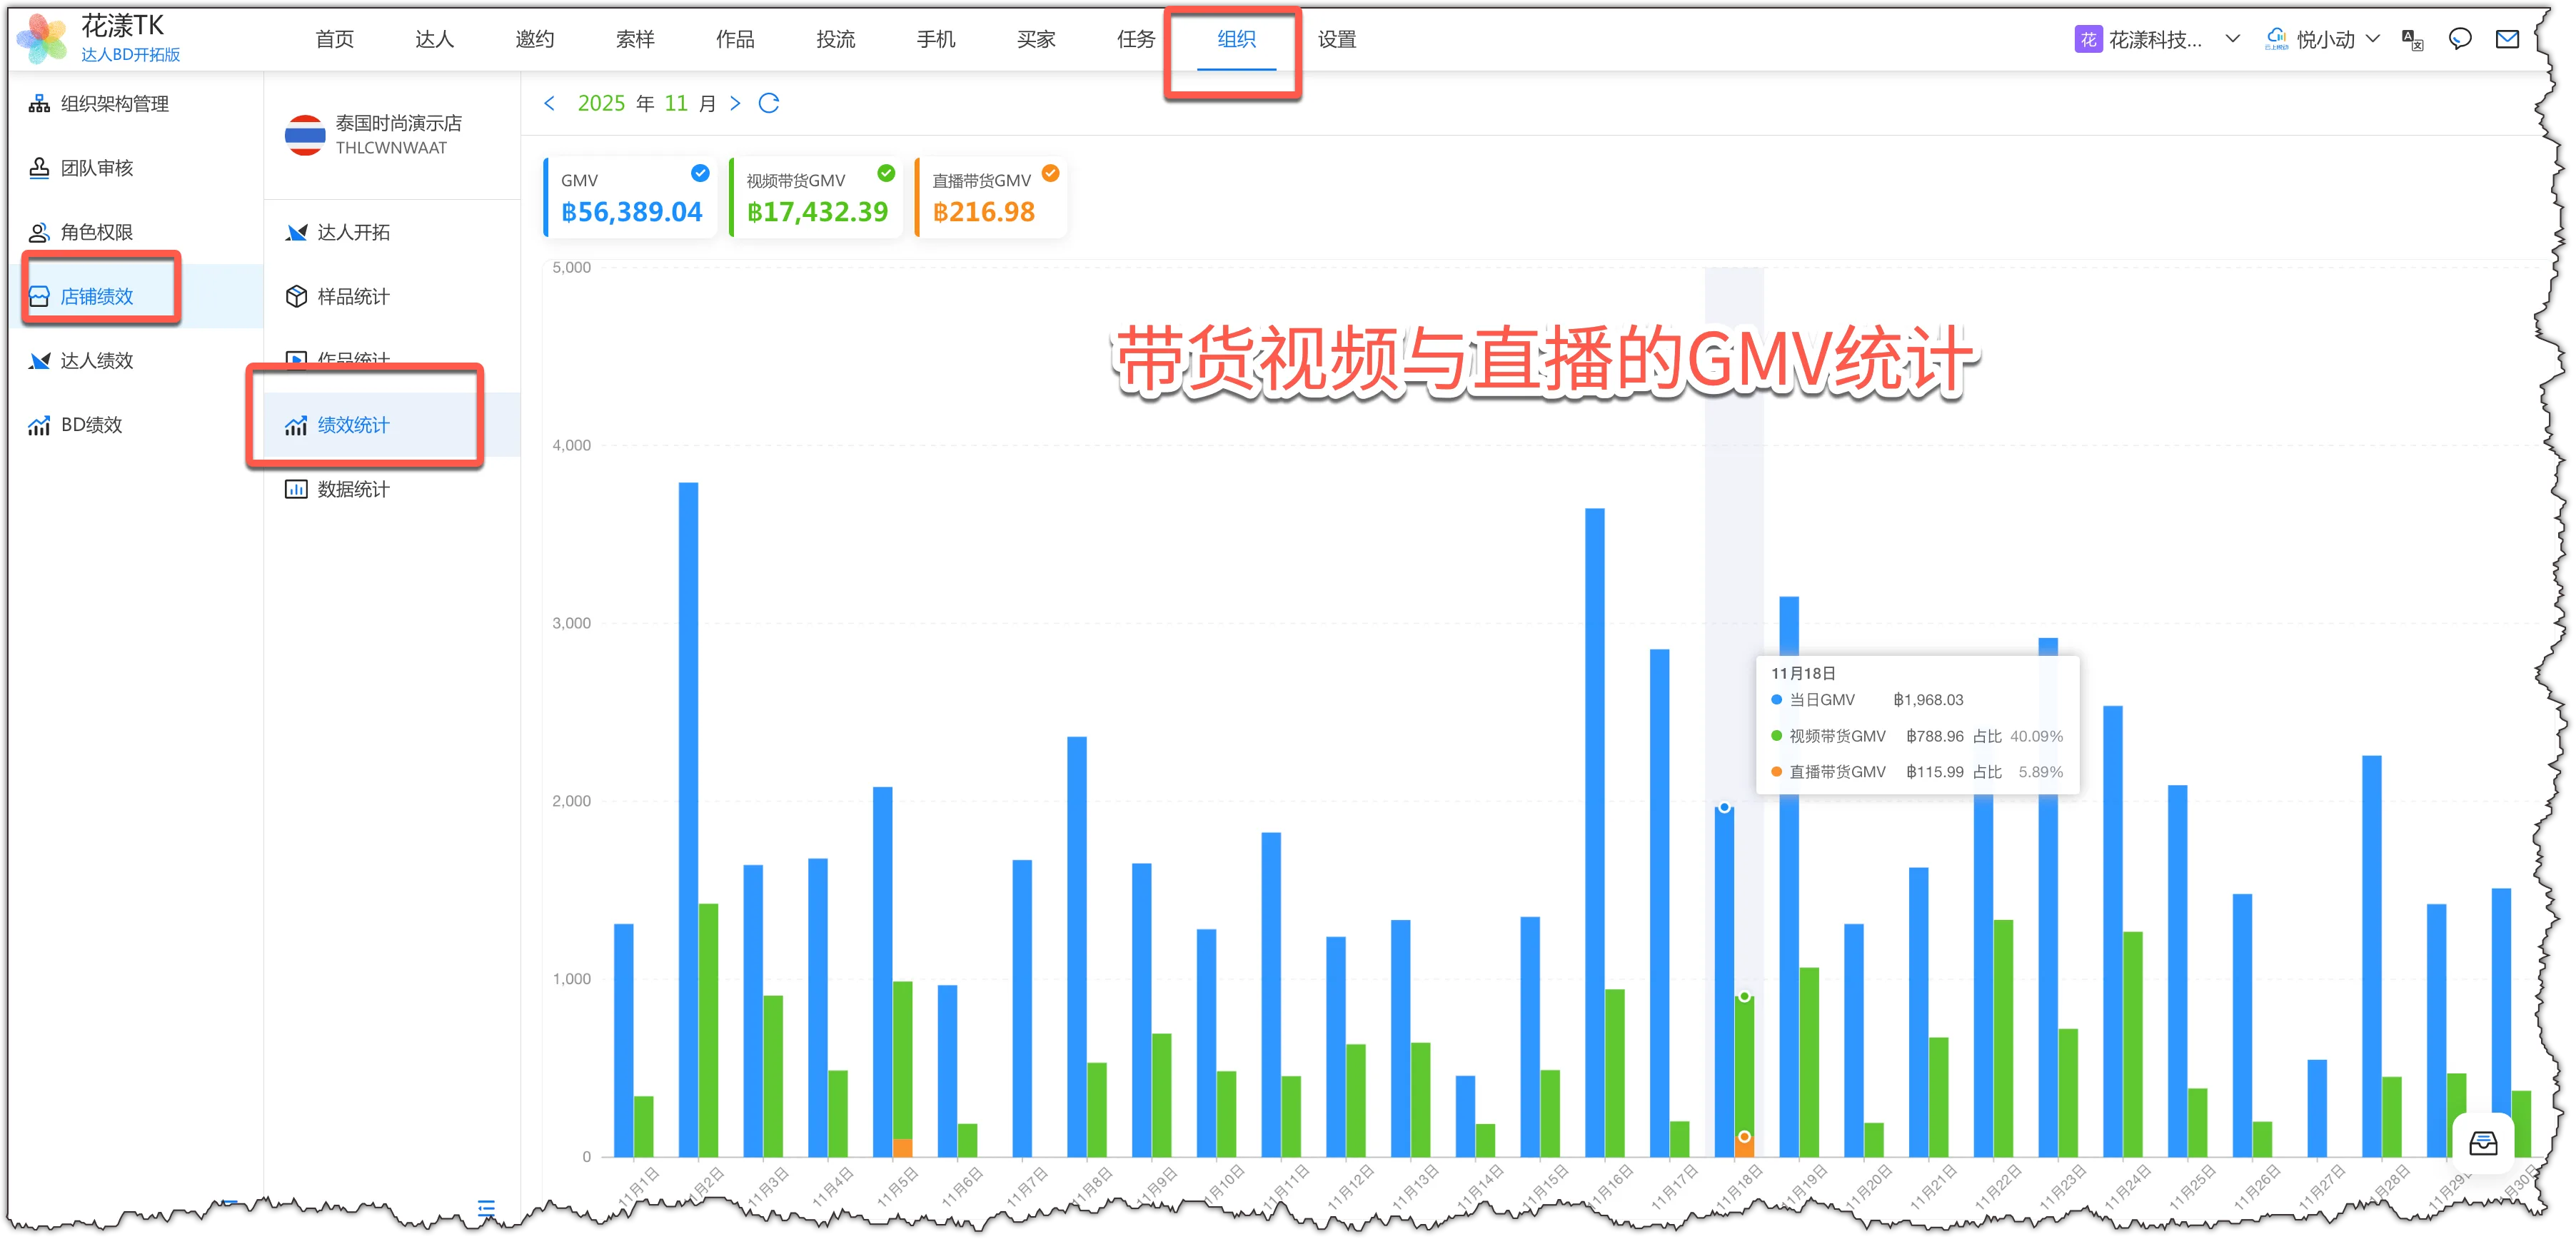
Channel contribution of total, video, and livestream GMV Management advice:
- Review the overall trend:mark peaks, sustained decline, and sharp changes in daily total GMV.
- Review channel mix:compare video and livestream GMV share to avoid over-reliance on one channel.
- Store and video GMV both rise:video is driving growth; review high-output videos and products for that day.
- Store GMV rises while creator GMV does not:validate other sales sources with store data.
- Livestream GMV concentrates on a few days:assess whether the schedule and host mix are sustainable.
- Cross-check anomaly days:compare each anomaly with that day's videos, livestreams, and products.
- 2.6
Raw Data
Raw Data presents a daily calendar summary of outreach, samples, and content—useful for cross-checking trends and anomaly dates, and exporting to Excel for further team review.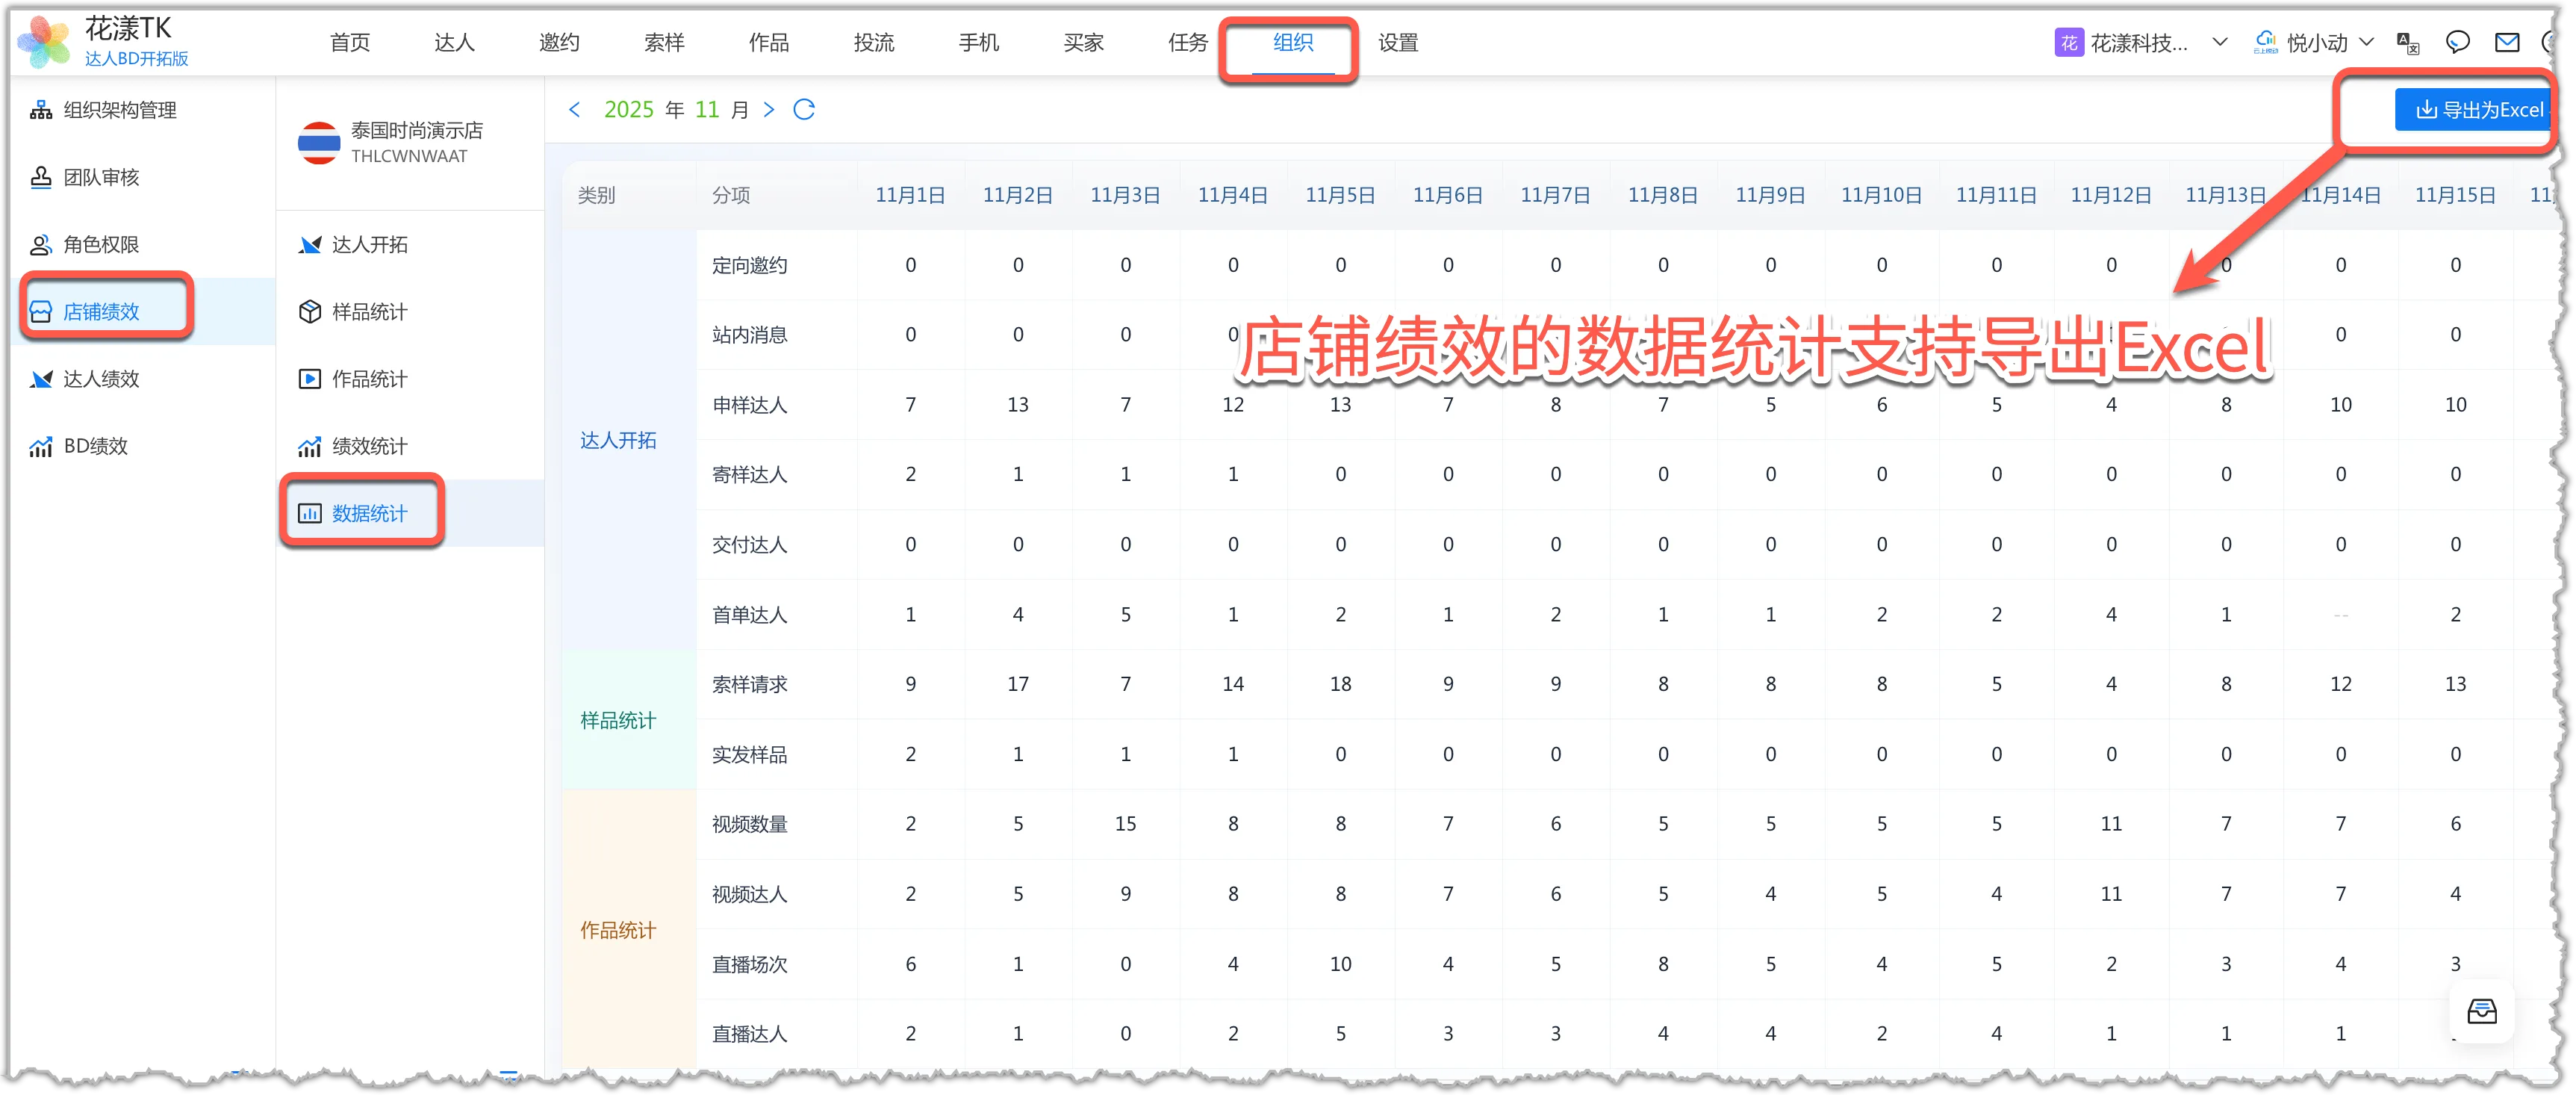
Store performance raw data supports Excel export Management advice:
- Locate anomaly days:compare outreach, samples, and content metrics to find the stage where the change is concentrated.
- Verify the cause:use execution records and synchronization timing to distinguish reduced activity, data delay, and a real business decline.
- Export for review:export to Excel for team analysis.
Creator Performance — Find and Grow Your "Superstars"
Goal
Key metrics
- •Samples, commission, and other costs in the selected calendar month
- •Videos, livestreams, valid orders, creator-driven GMV, and ROI
- •Item-level creator performance: products, content, orders, GMV, and commission
- 3.1
Performance Overview
Creator Performance aggregates spend and output by calendar month. Compare creators by cost, content, orders, GMV, and ROI to quickly identify high-value partners and those needing closer attention.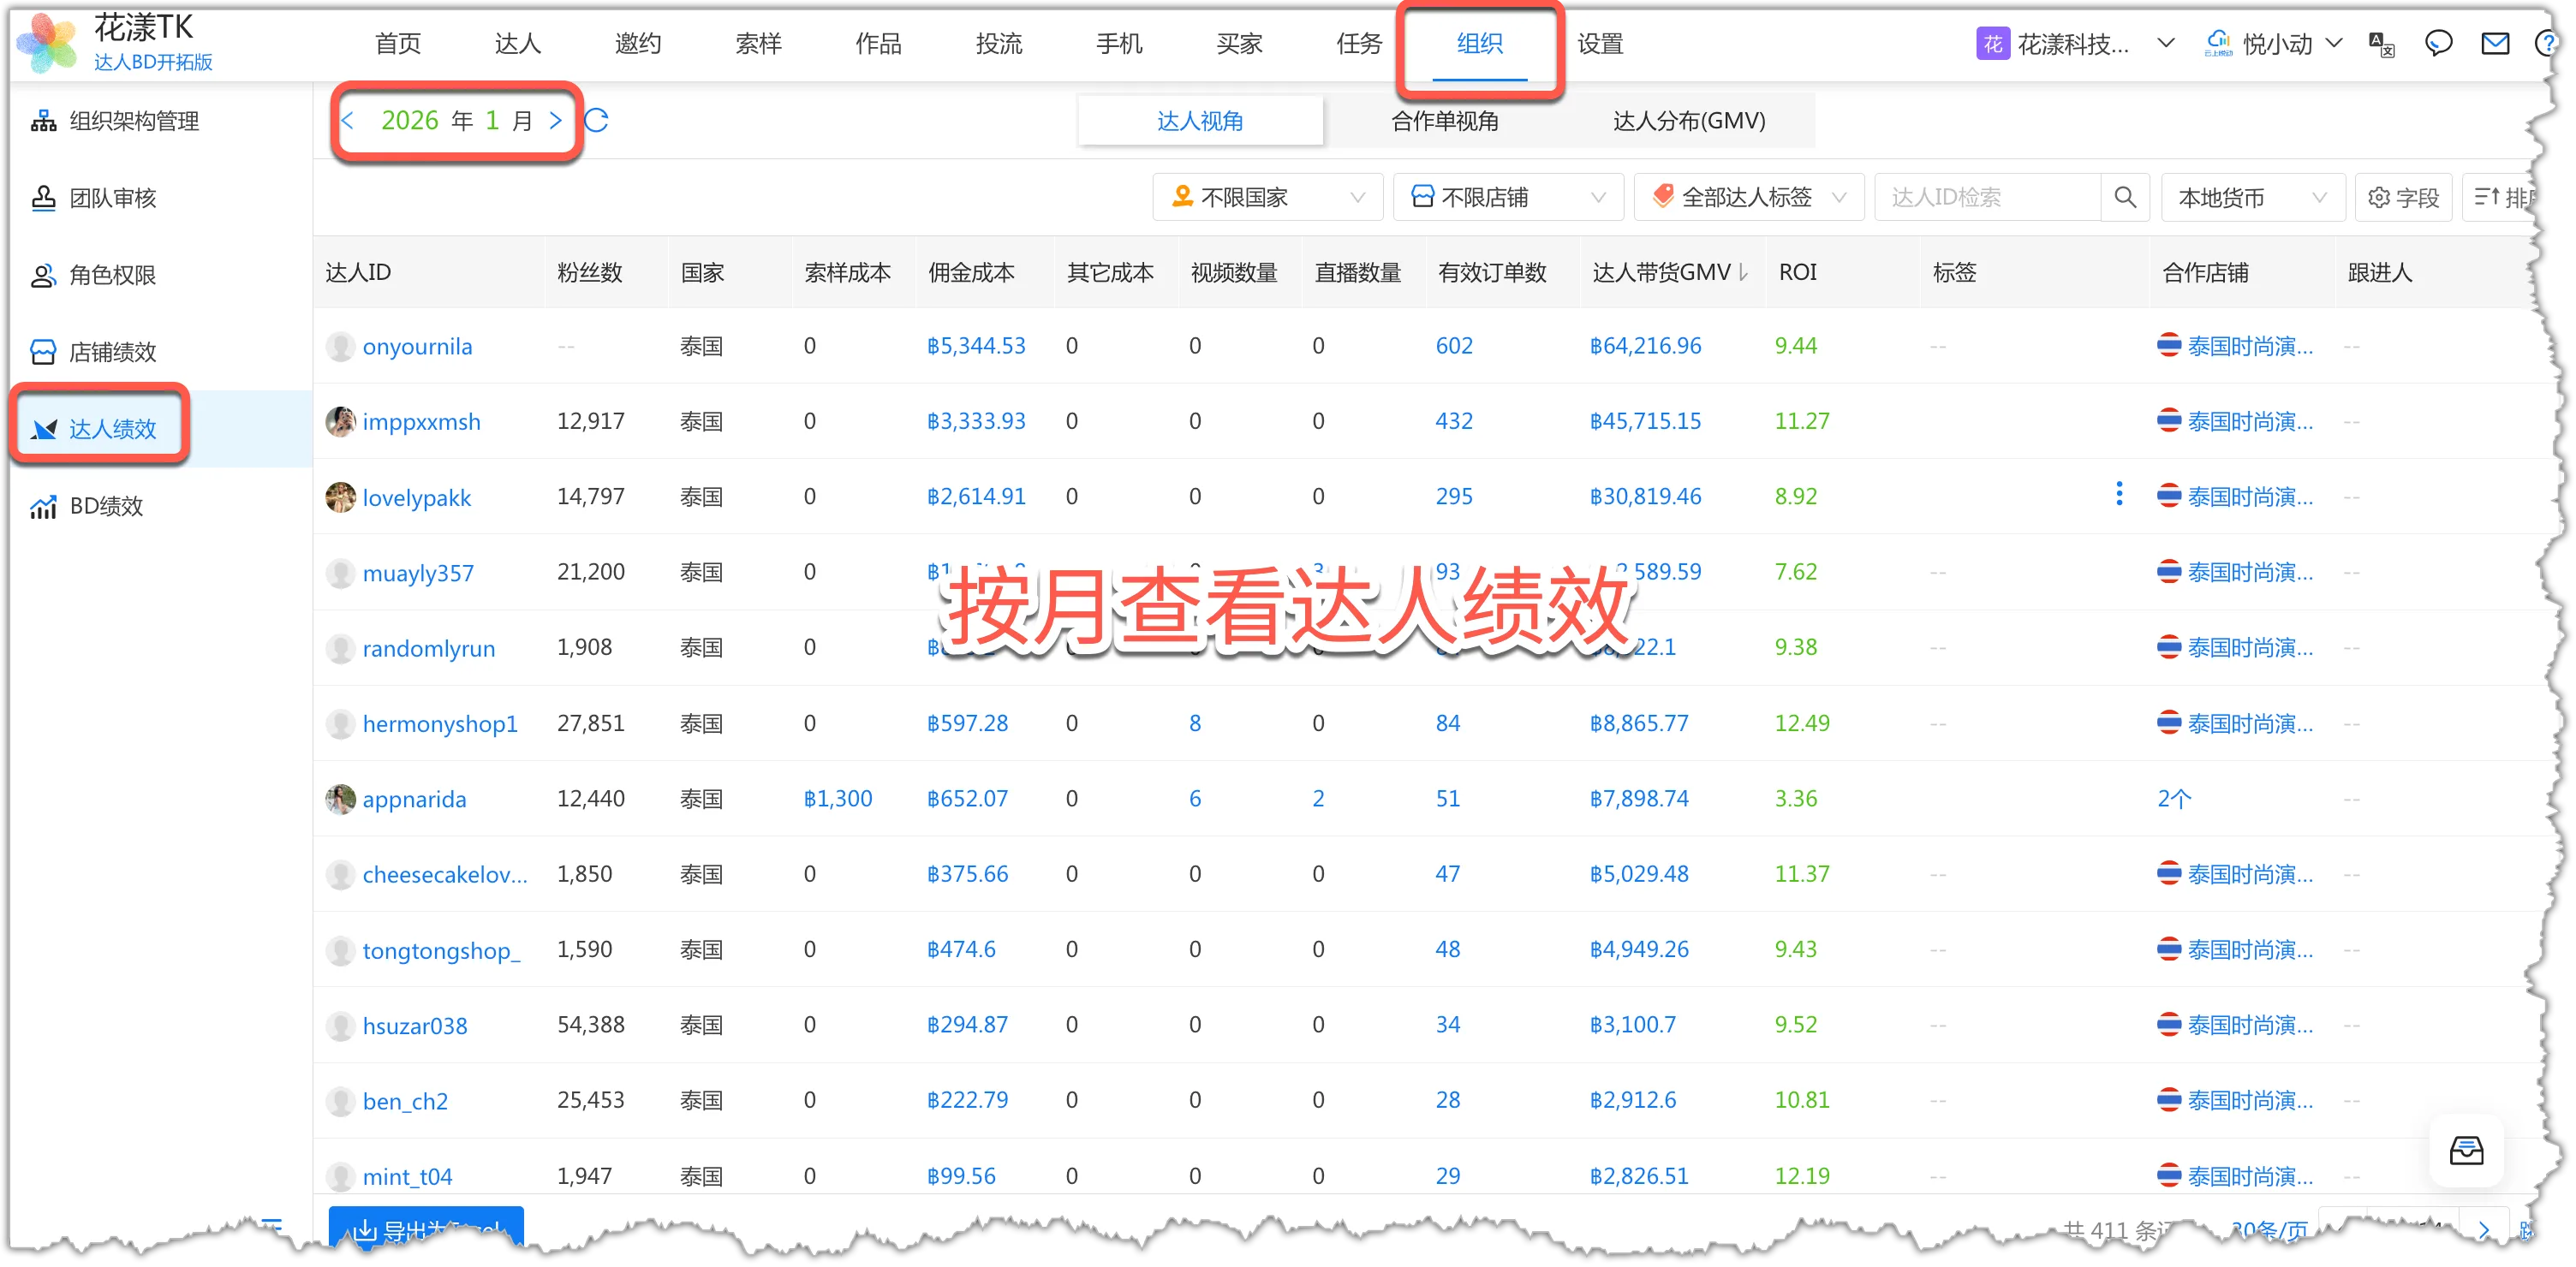
View monthly creator performance Management advice:
- Concentration risk:check whether GMV is overly concentrated among top creators.
- Overall efficiency:use ROI to identify low-ROI creator outliers.
- Top-tier stability:check whether top creators deliver stable GMV and ROI before further drilldown.
- 3.2
Creator Performance Detail
Click a creator to open the detail panel. Compare their selling power, last 30 days of team-driven sales, and all-time collaboration data, including spend, output, valid orders, and ROI. The list surfaces candidates; the detail panel judges quality.Management advice:
- Monthly essentials:review monthly GMV, orders, and ROI, then verify samples, commission, and other costs.
- Internal and external comparison:compare a creator's wider selling power with the results delivered for your team.
- ROI health check:investigate costs when GMV is high but ROI is low; assess scaling potential when ROI is high but volume is small.
- Check concentration:determine whether GMV depends on one product or one video.
- Content and conversion:check whether high-view content also generates orders.
- Reinvest or watch:reinvest in consistently converting core creators; keep one-off breakout creators under observation.
-
3.2.1 Drill into a core creator's products and content
Tell whether a creator reaches the core tier through sustained content supply and multi-product synergy, or from a single viral hit.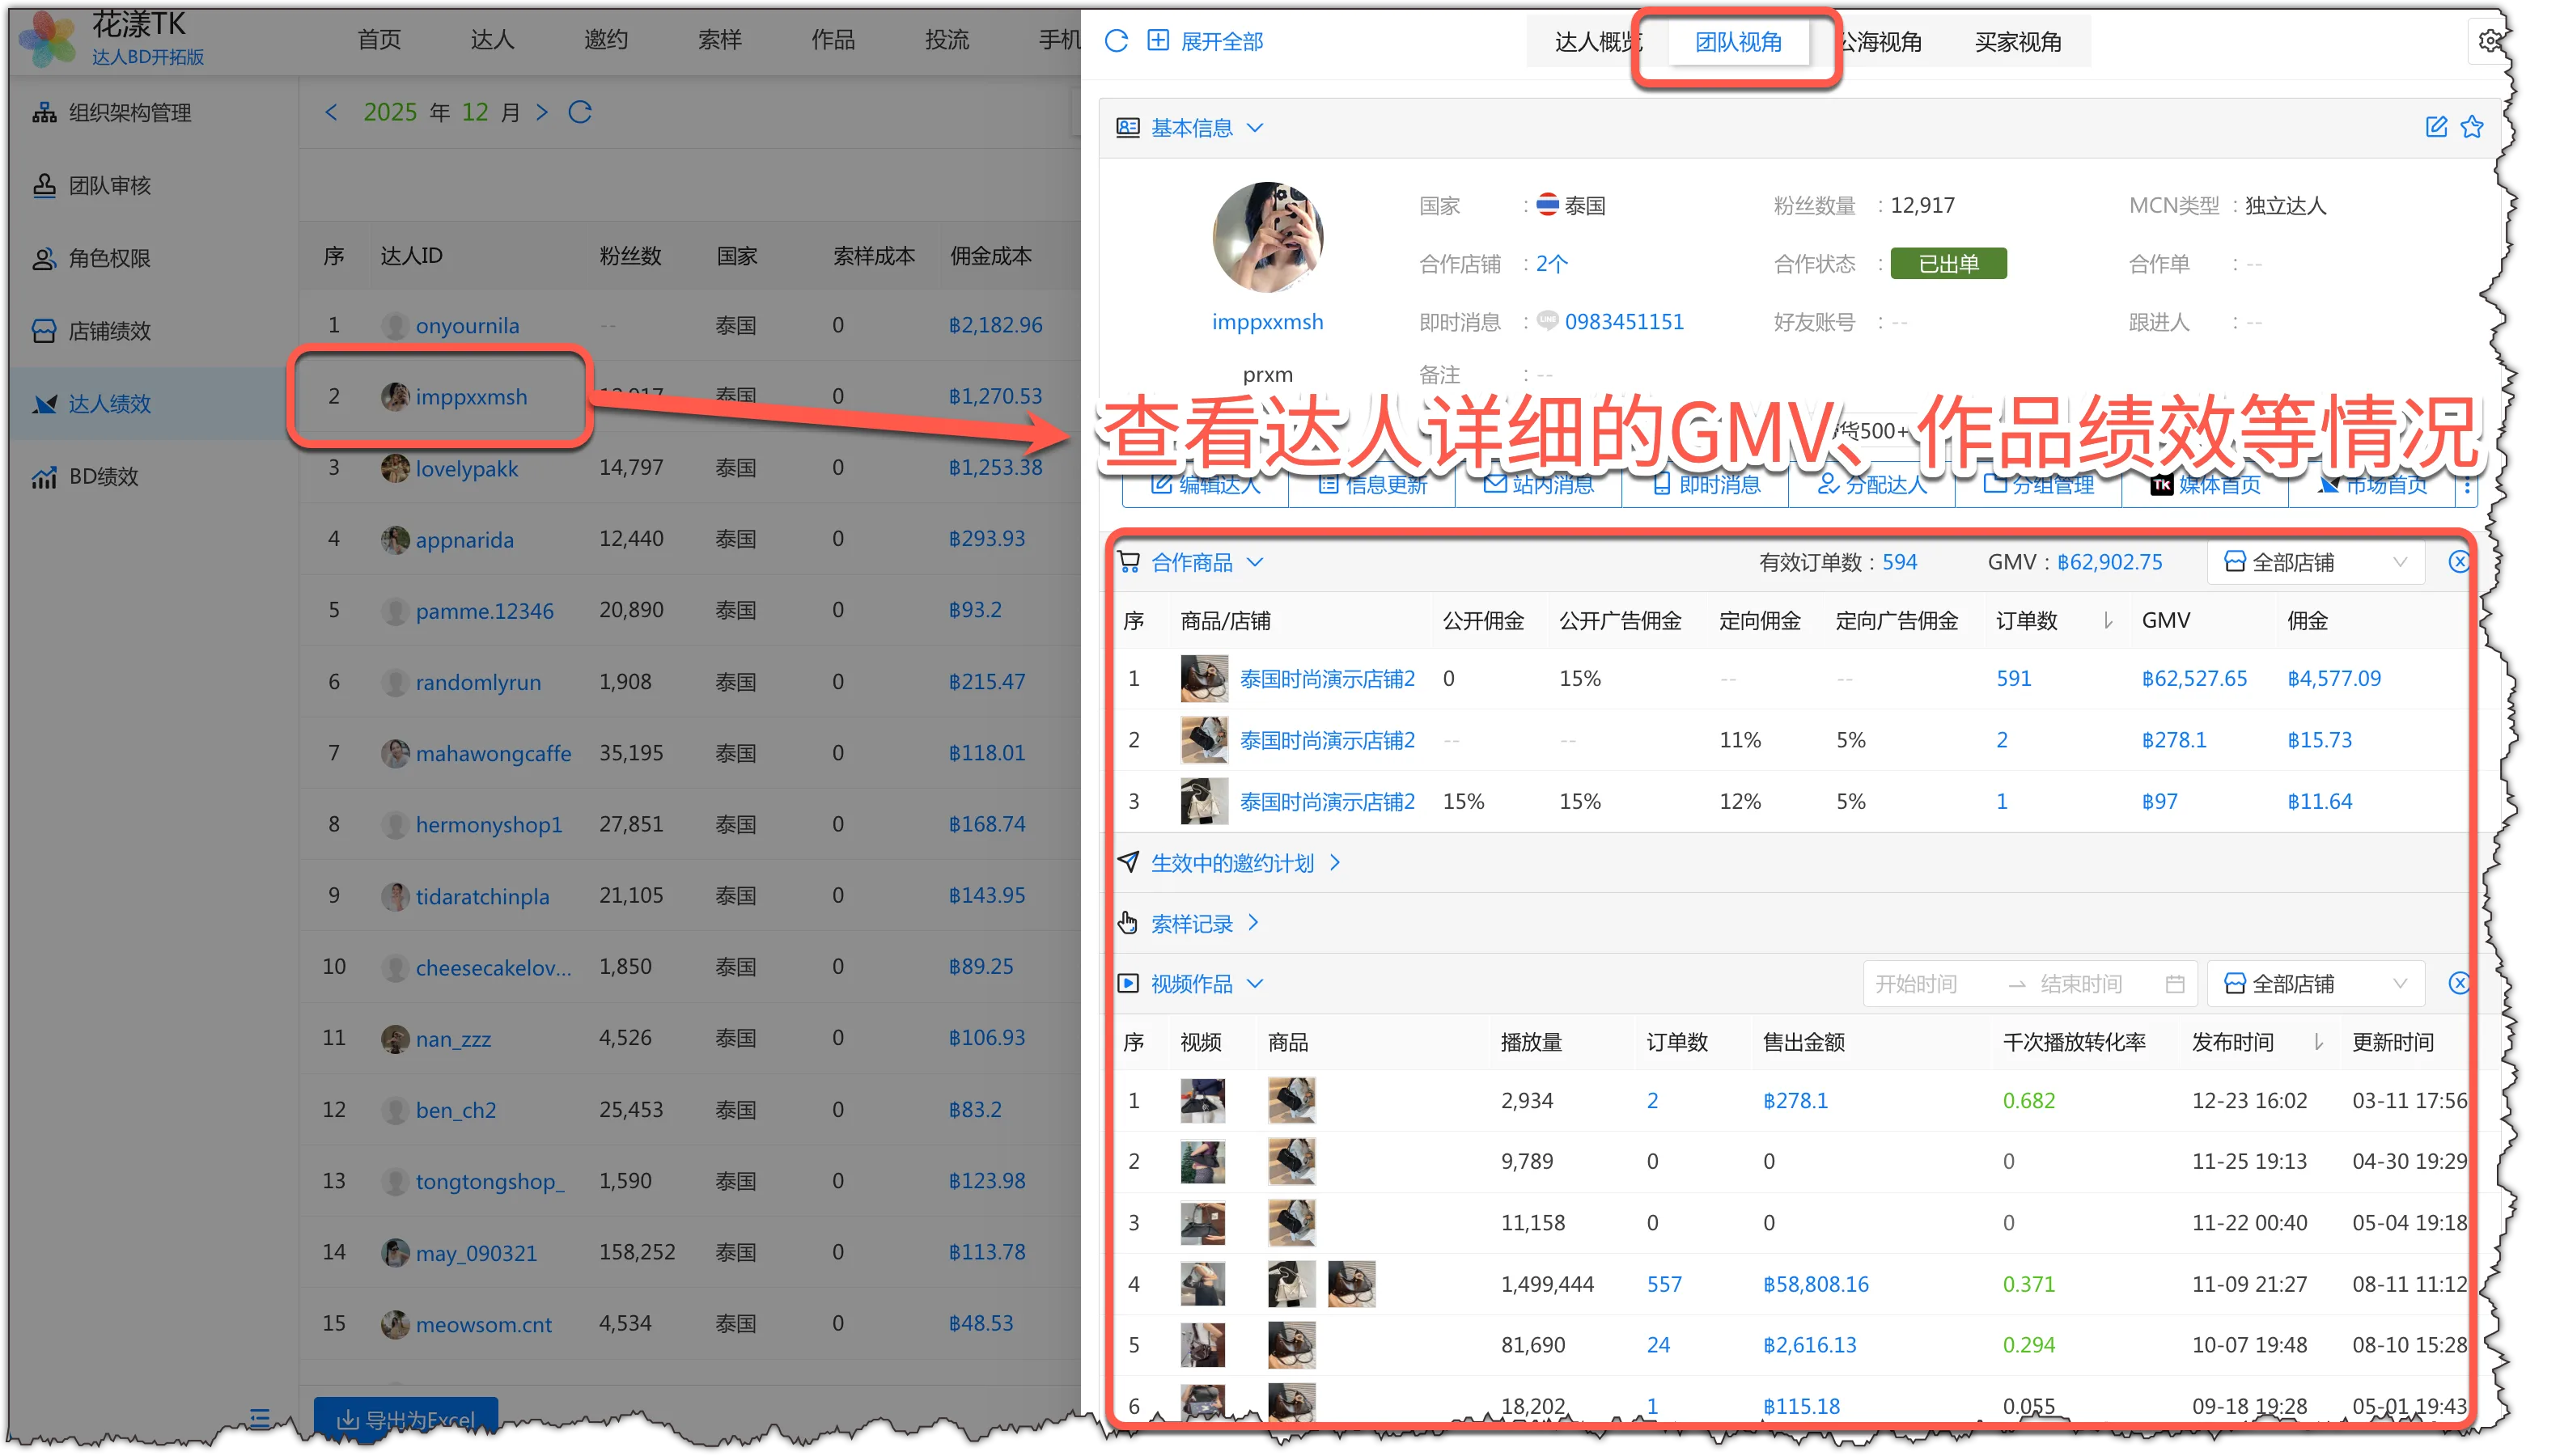
View detailed GMV, orders, commission, samples, sample requests, and content for a creator
BD Performance — Build a High-output Sales Team
Goal
Key metrics
- •Whether the attribution model fits the team's collaboration complexity
- •Whether creator outreach and maintenance have clear ownership and traceable attribution
- •Whether attribution across people, products, and time periods is accurate
- •Per-BD creator quality, ROI, and sustained output capability
- 4.1
Step 1: Enable BD Features
To manage and analyze BD performance, upgrade to the HuaYoung TK BD Expansion Edition (How to upgrade to the BD Expansion Edition). Then enable the relevant BD features in Settings as shown below. At this point, the system will ask you to pick the collaboration scenario that best fits your BD-and-creator relationship.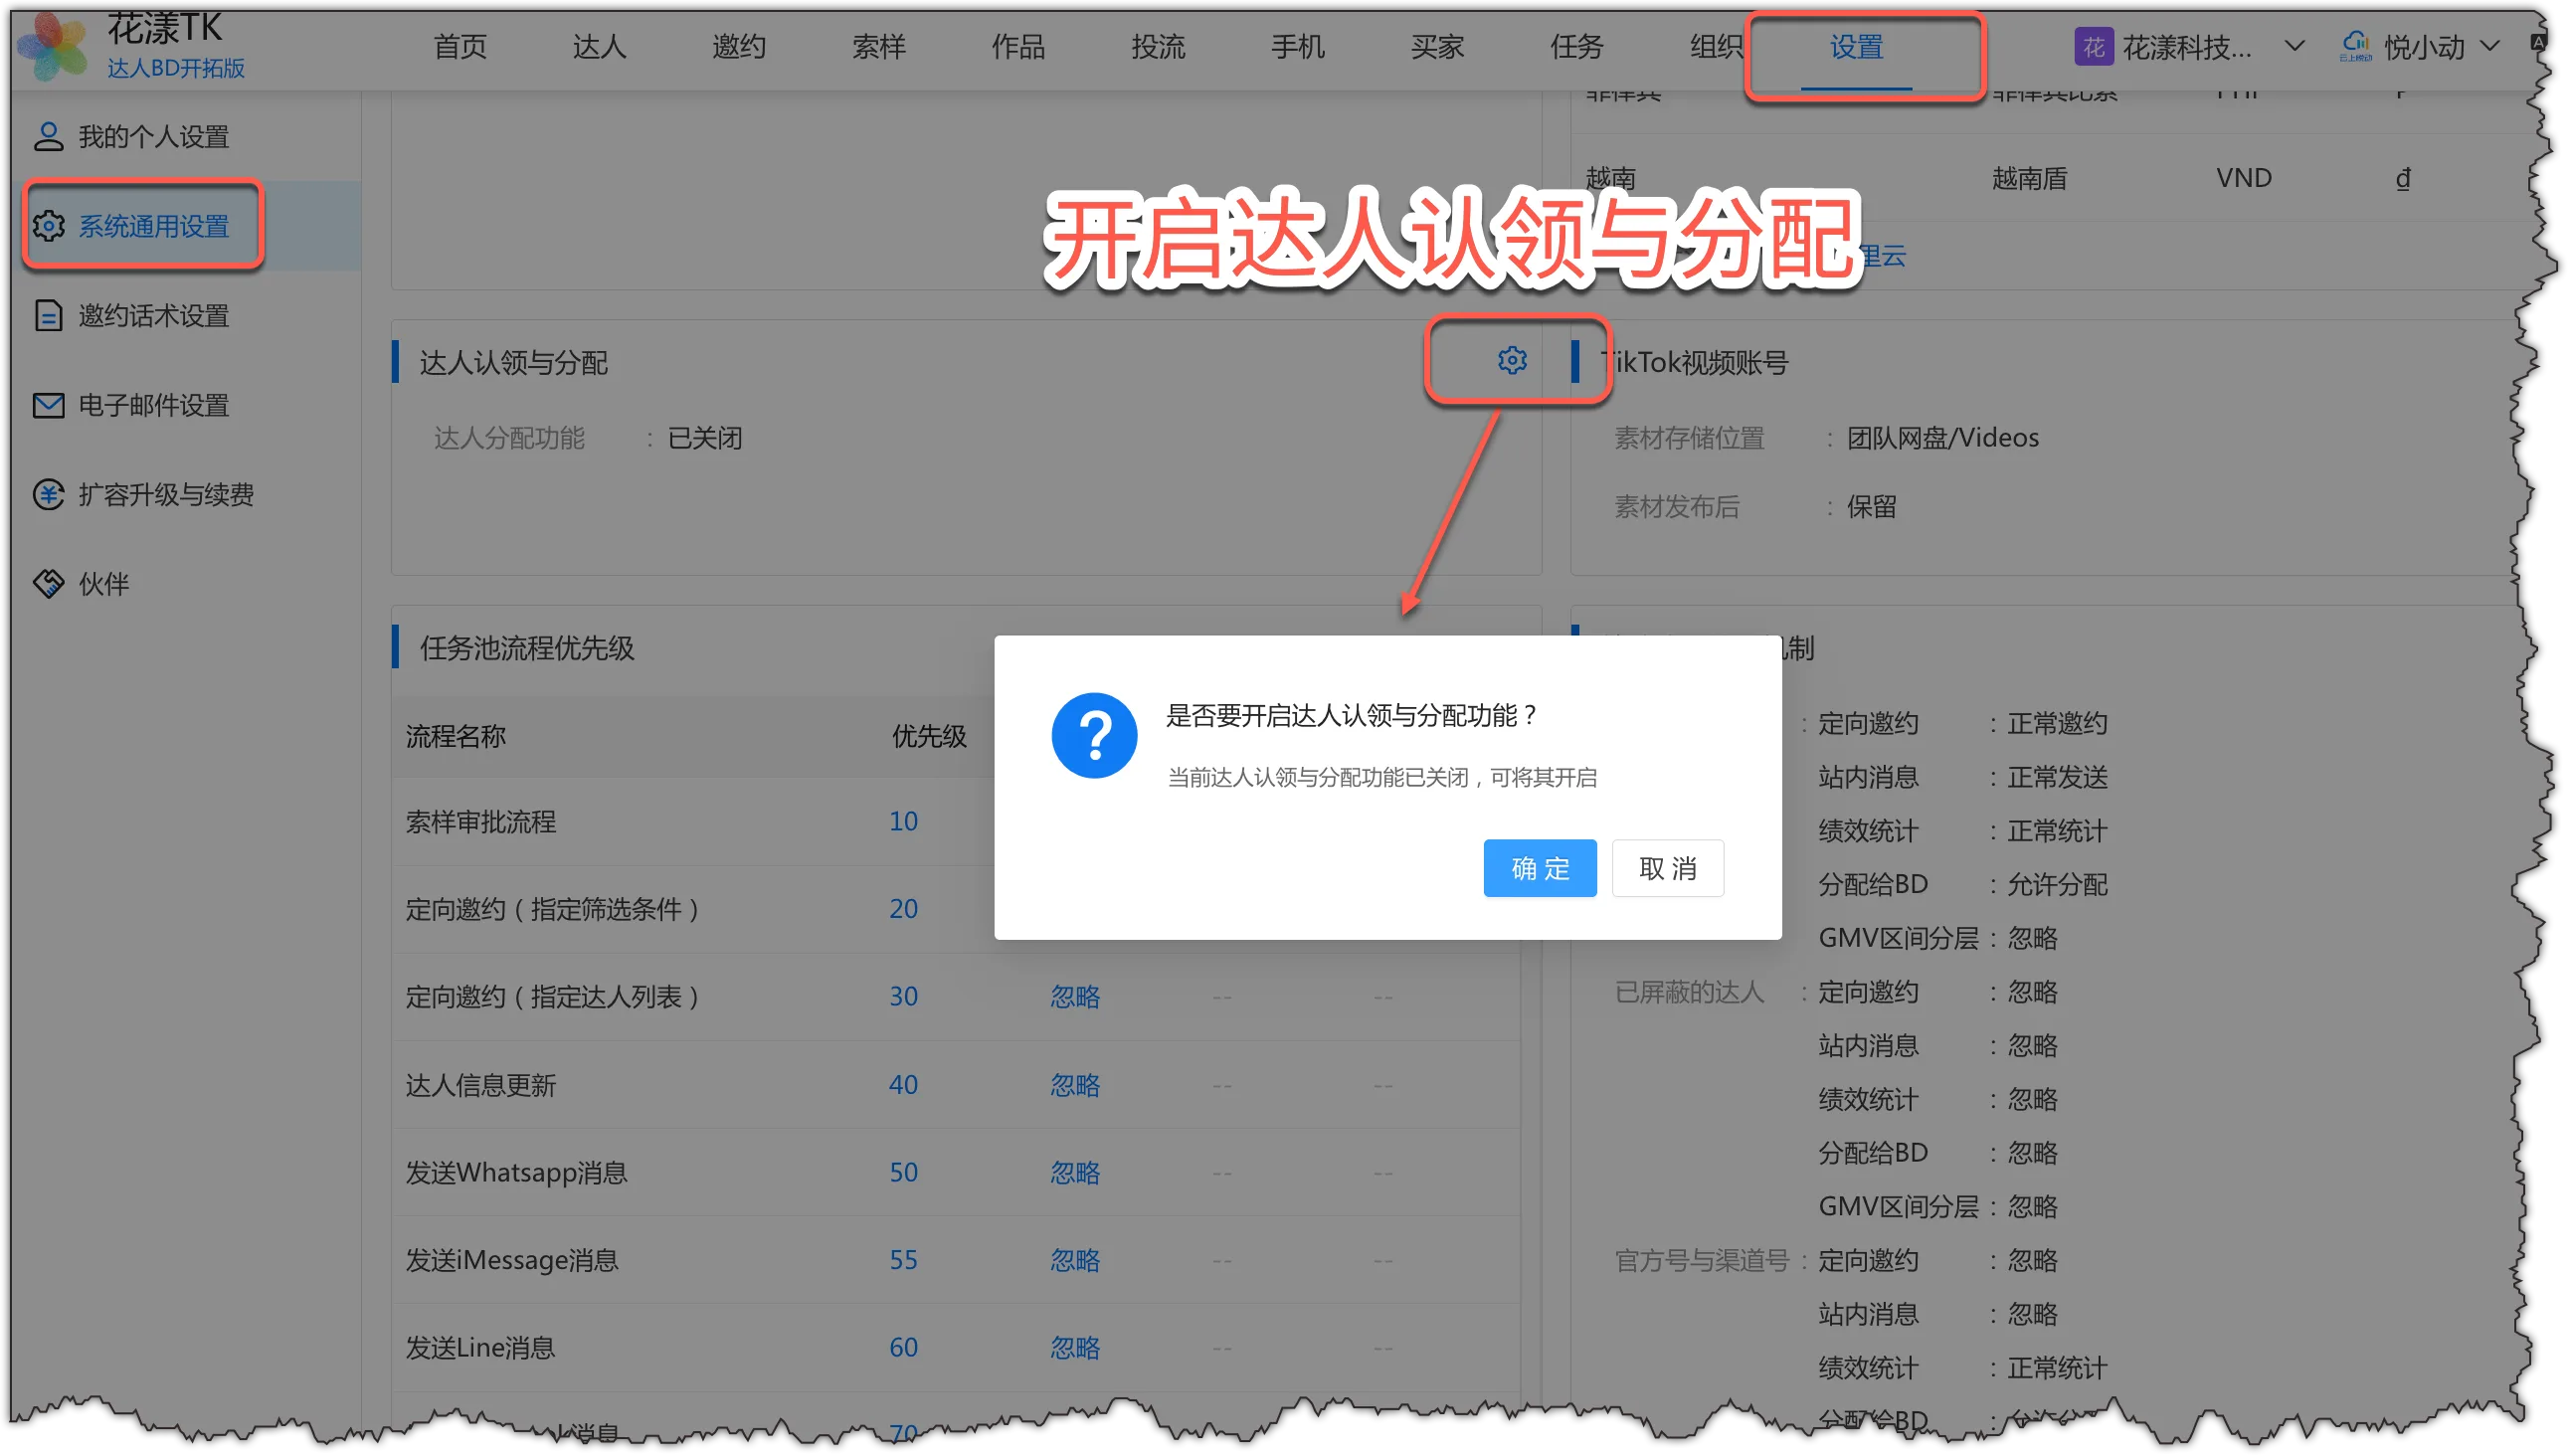
Enable creator claim and assignment 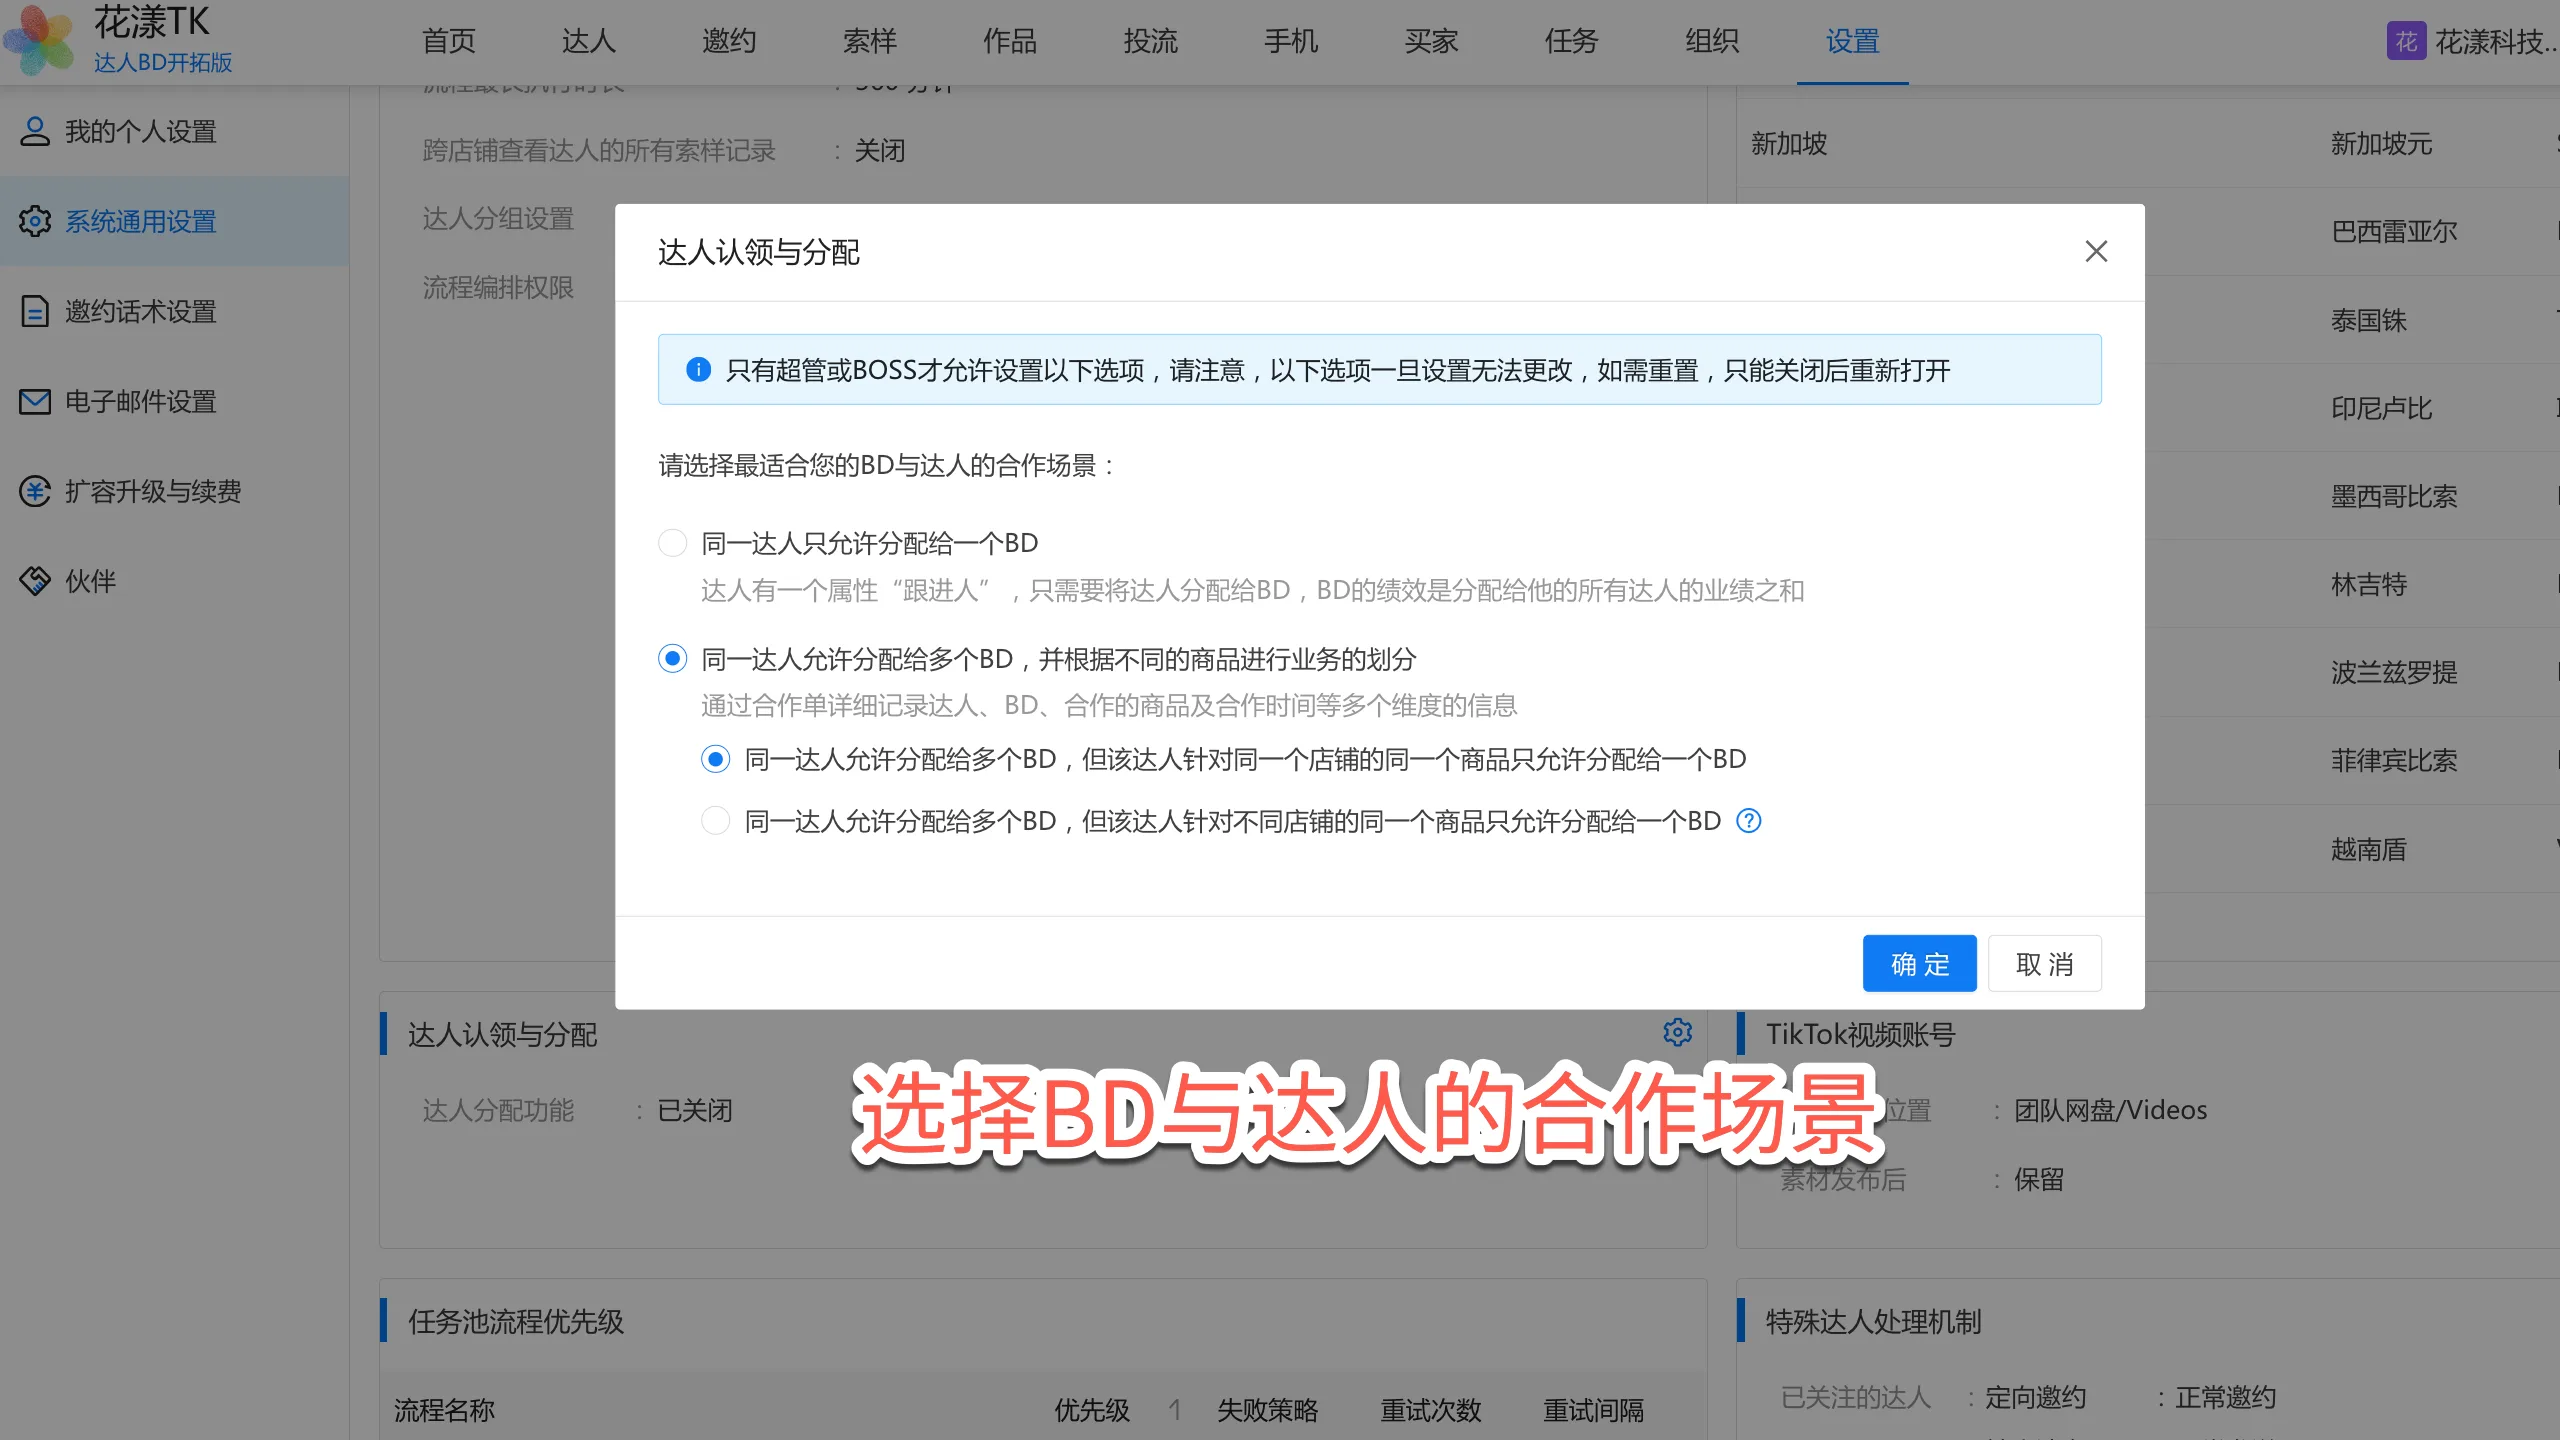
Choose a collaboration scenario Scenario 1: One Creator assigned to one BD at a time
- Core mechanism:
- exclusive assignment: each Creator has one responsible BD.
- Performance calculation:
- performance after the assigned collaboration start time belongs to that BD.
- Best for:
- smaller sellers with straightforward operations.
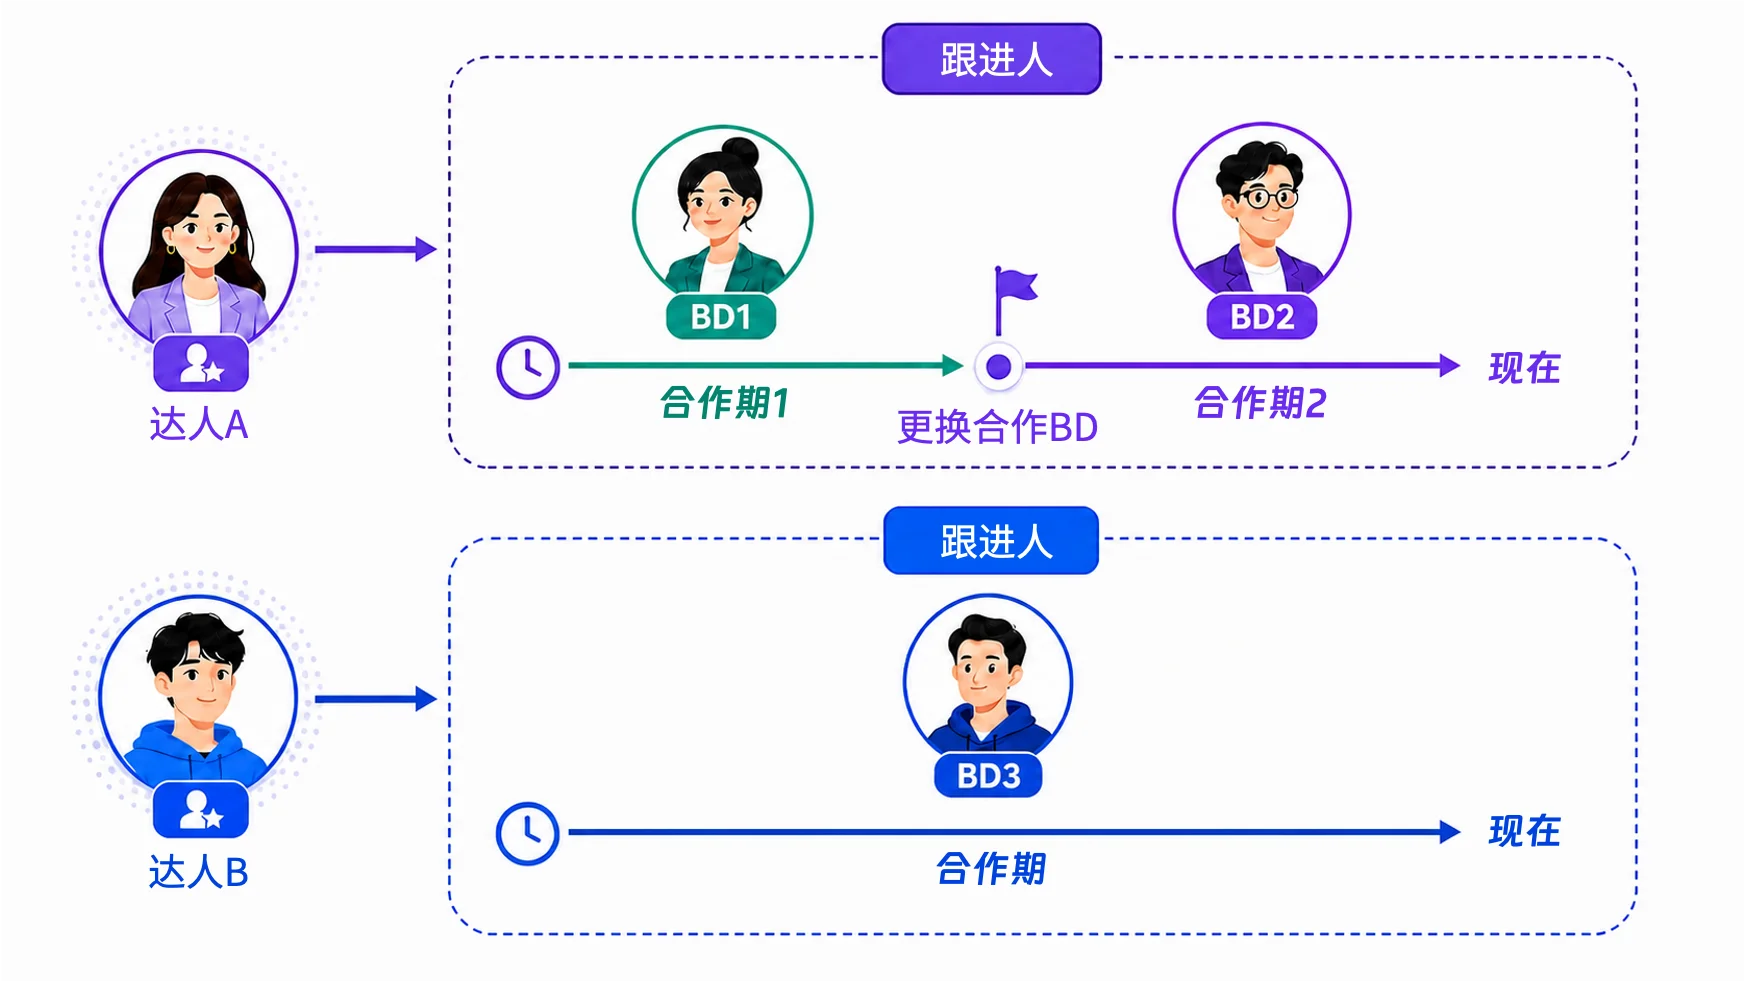
Scenario 1 overview Scenario 2: Multiple BDs assigned to one Creator by product
- Core mechanism:
- non-exclusive assignment: multiple BDs can manage the same Creator, each for different products.
- Performance calculation:
- collaboration orders record Creator, BD, product, and collaboration period for granular attribution.
- Best for:
- mid-sized and large sellers that need more granular management.

Scenario 2 overview Recommendation:Start with Scenario 1 when the BD team and operating model are simple; move to Scenario 2 as complexity grows.
- 4.2
Step 2: Assign Creators to BDs
After enabling BD features—regardless of the scenario you chose in step 1—you need to assign creators to BDs. Only then can the system track BD–creator collaboration and compute BD performance. There are two ways to assign:4.2.1 Method 1: BDs claim creators
By default, BDs can claim creators themselves from the team creator library.
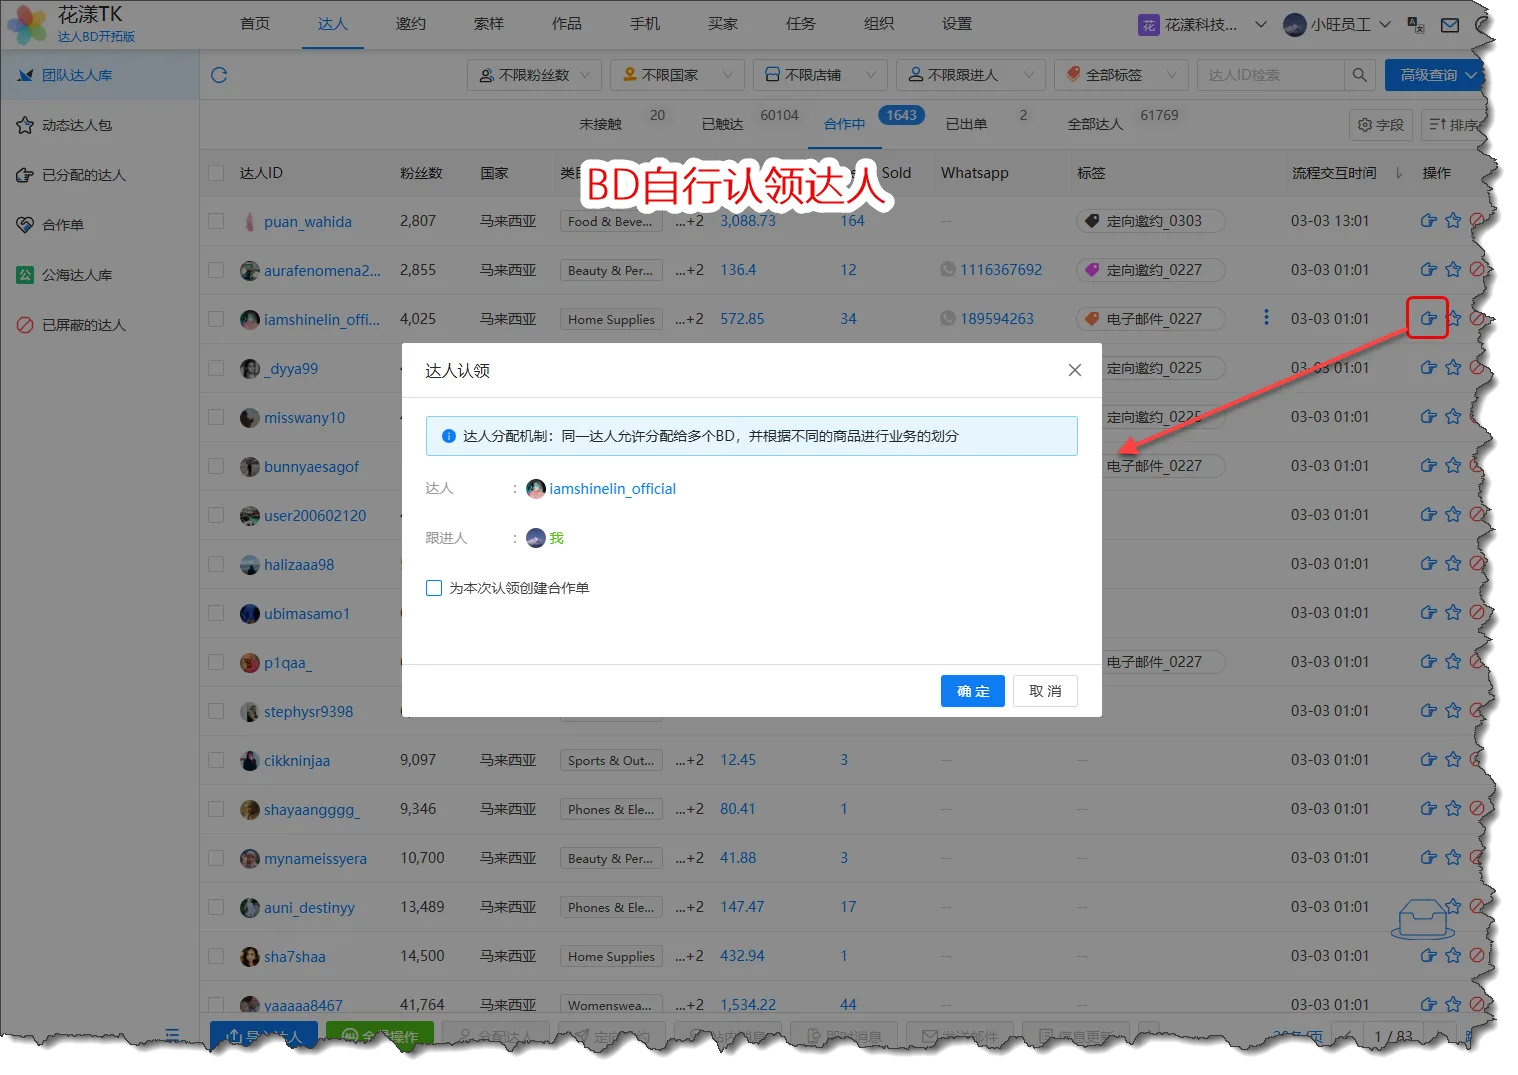
Claim a creator Configure whether BDs may claim creators in Advanced Settings.
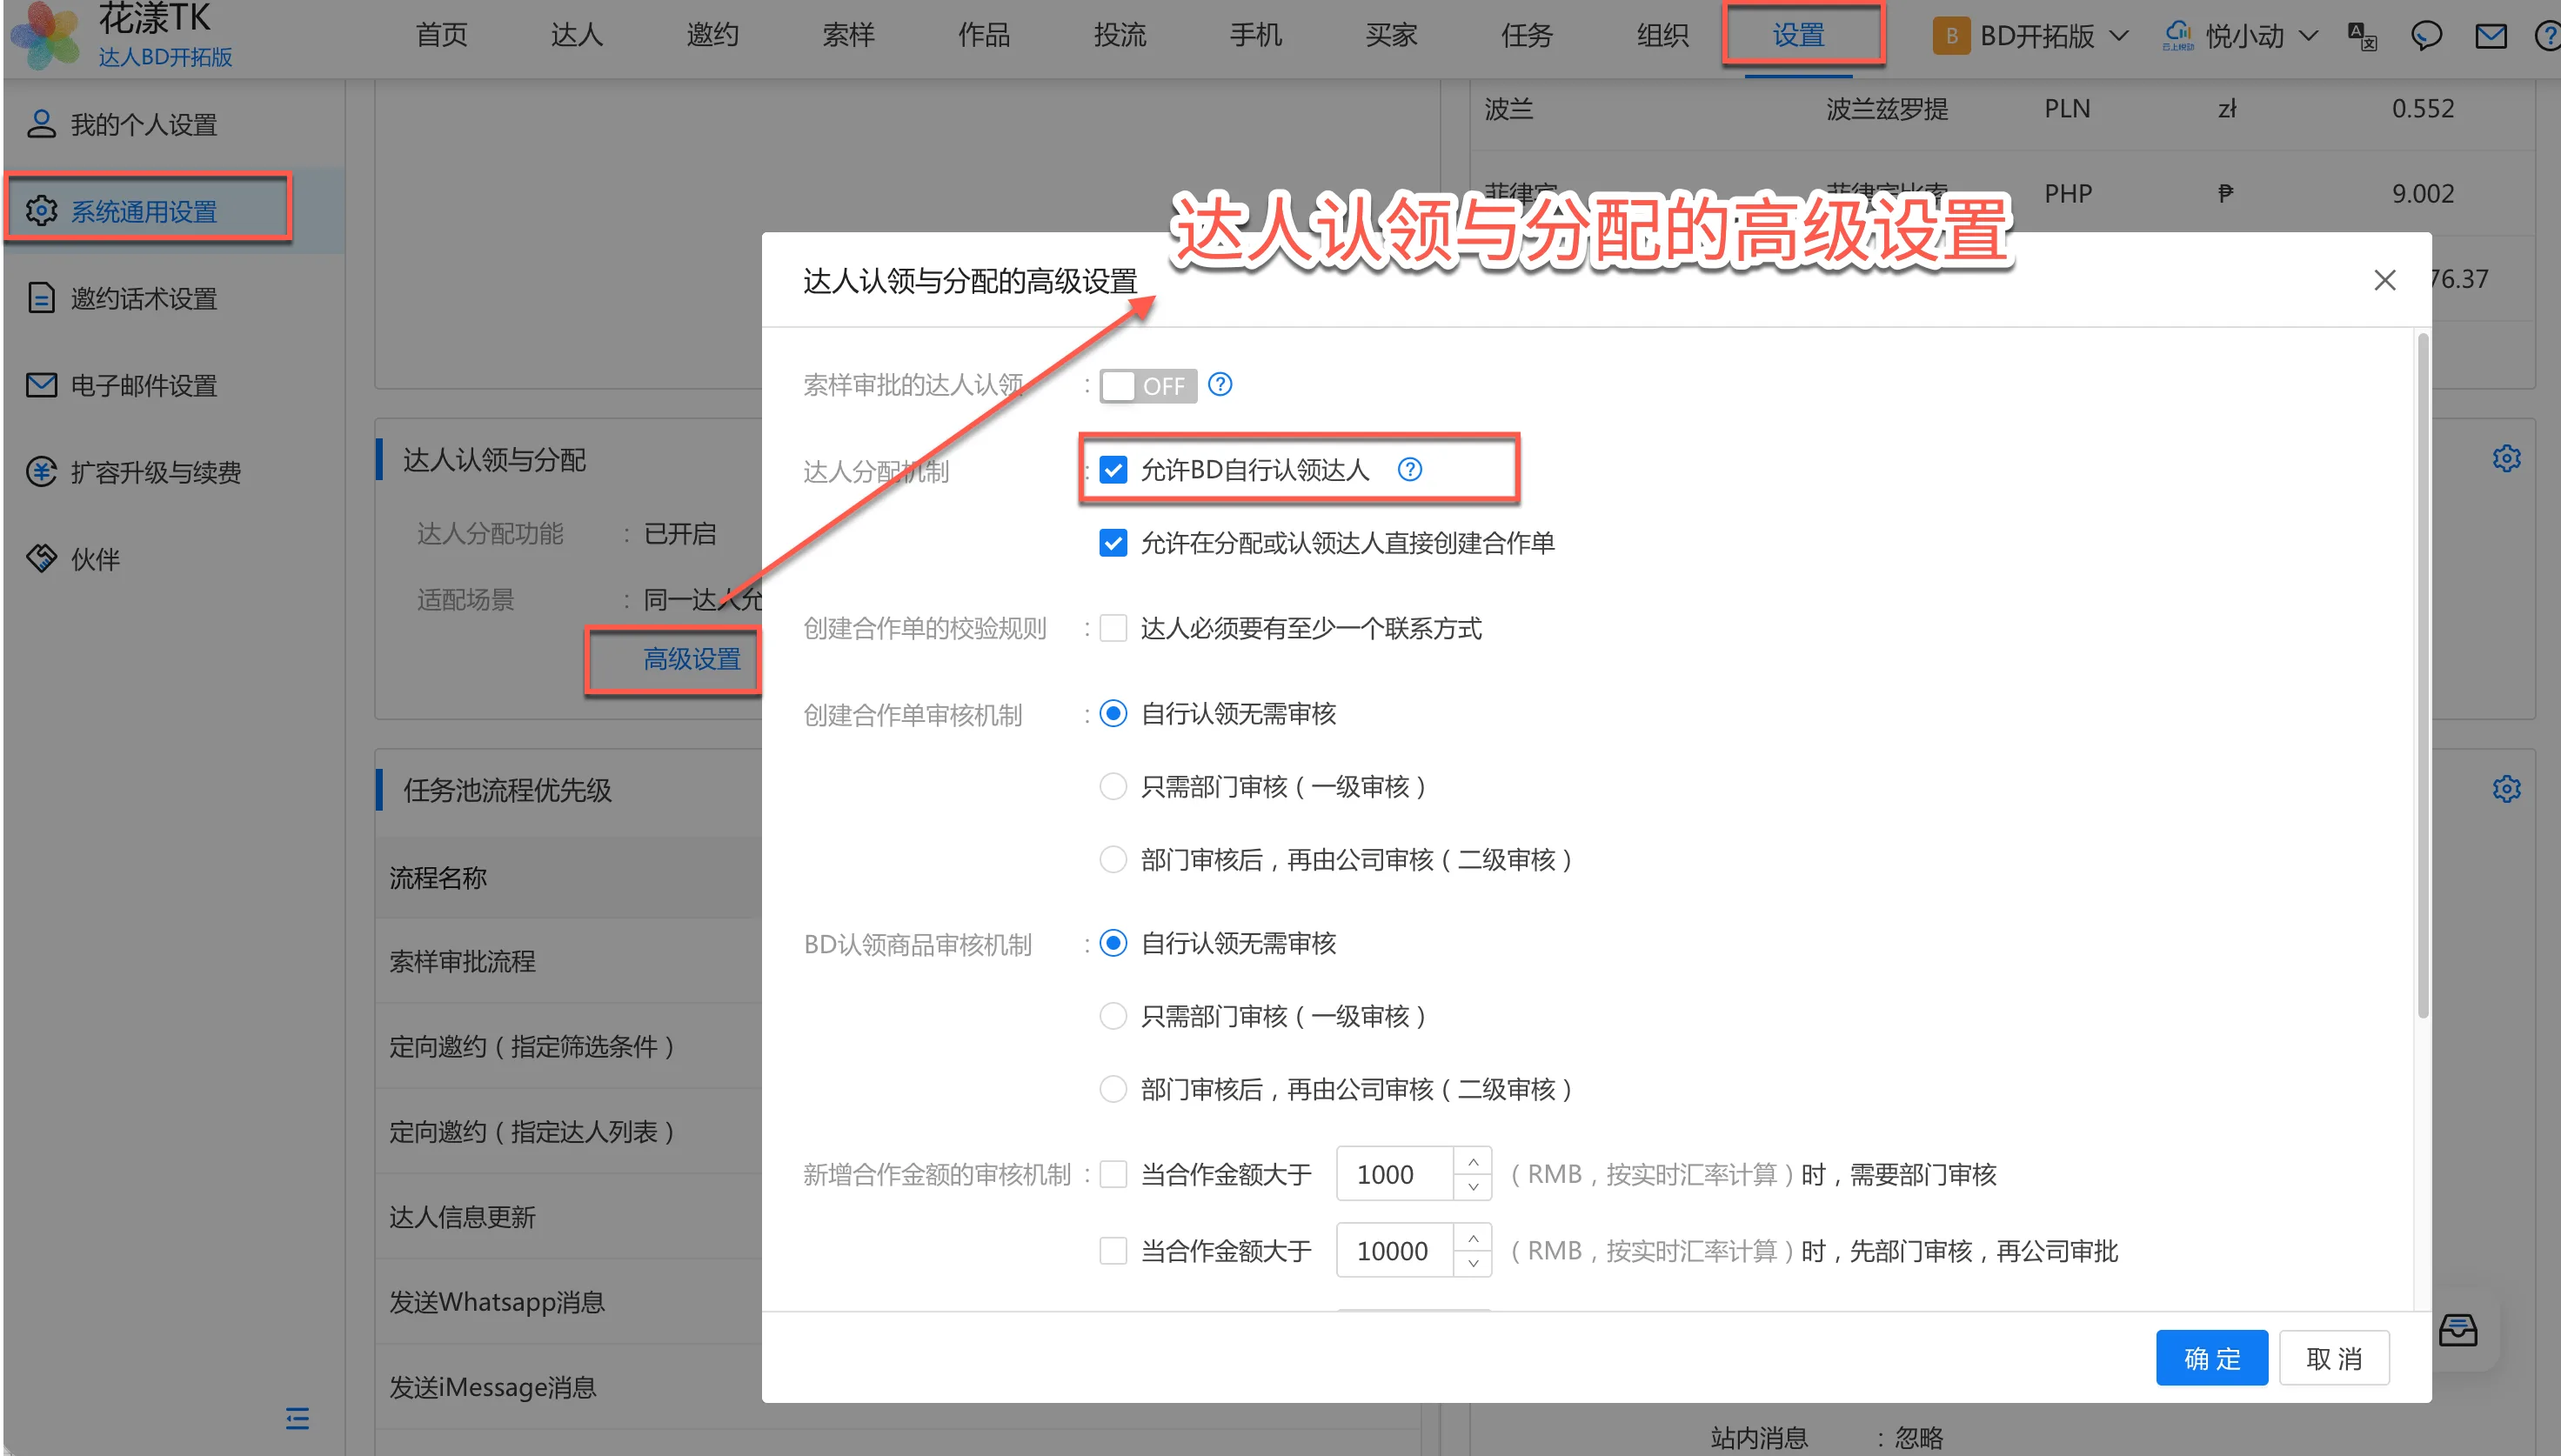
Configure creator claiming 4.2.2 Method 2: A manager assigns creators
Owners and managers can assign creators to BDs according to business needs.
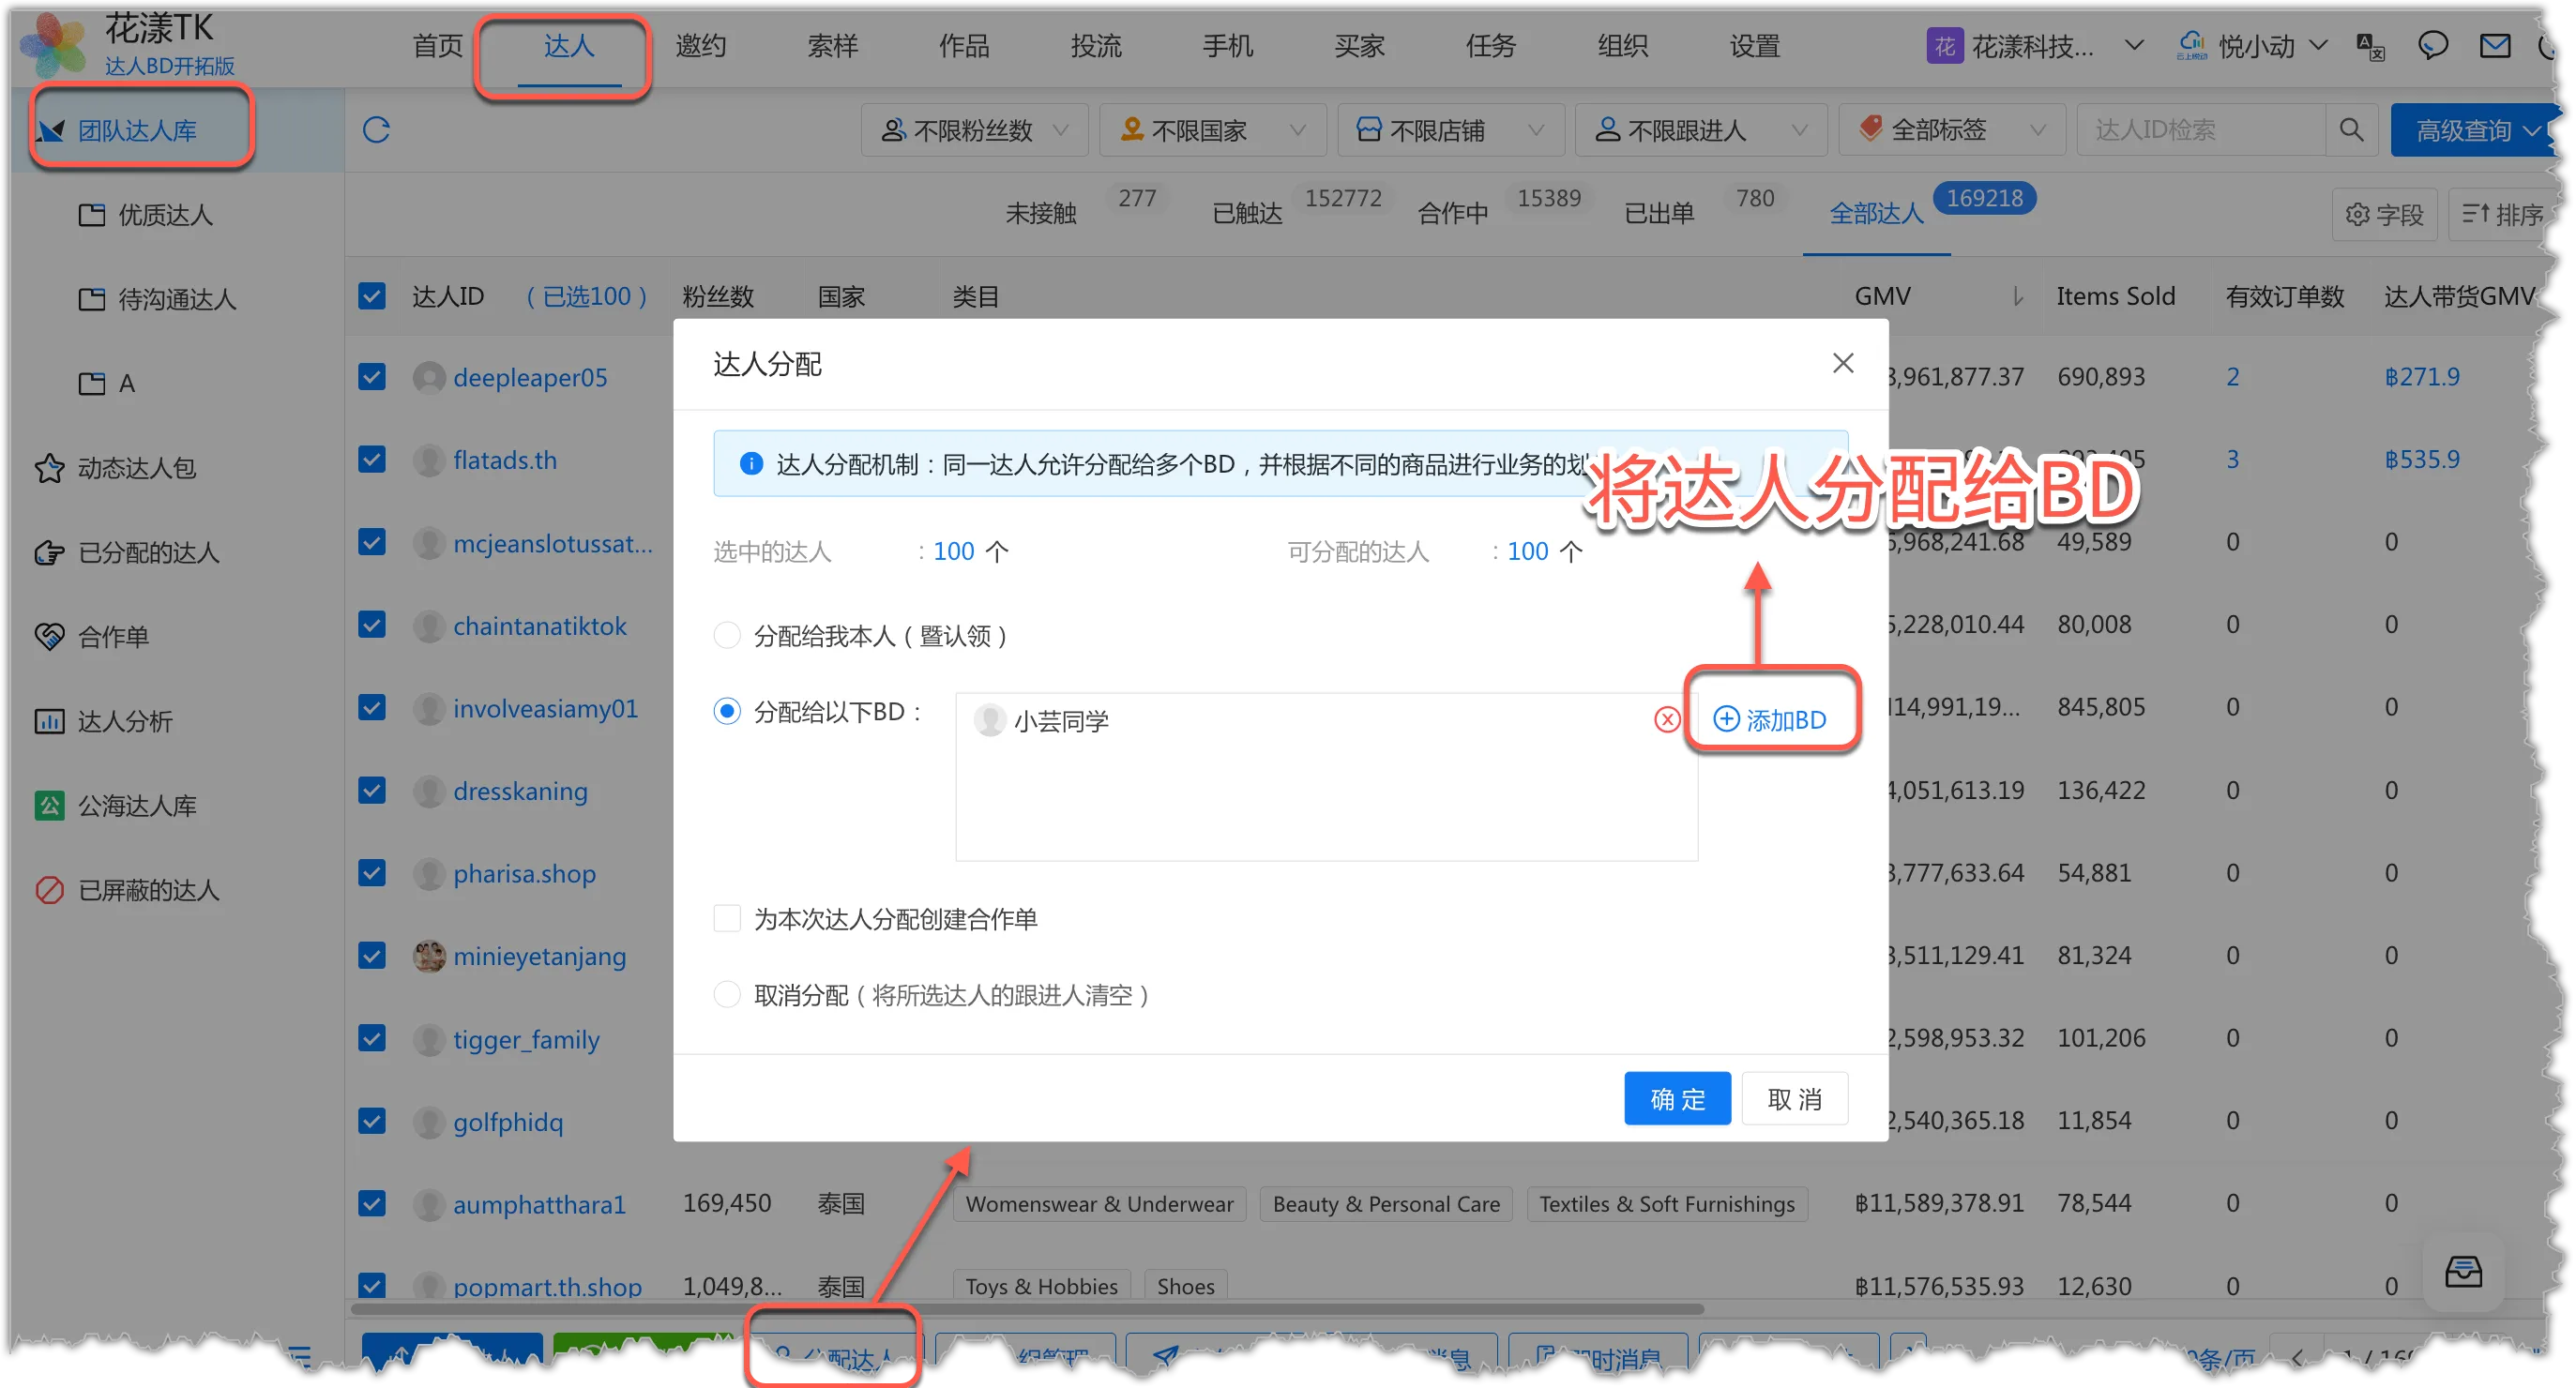
Assign a creator to a BD 4.2.3 View assigned creators
In Assigned Creators, view creators assigned to you and to your department.
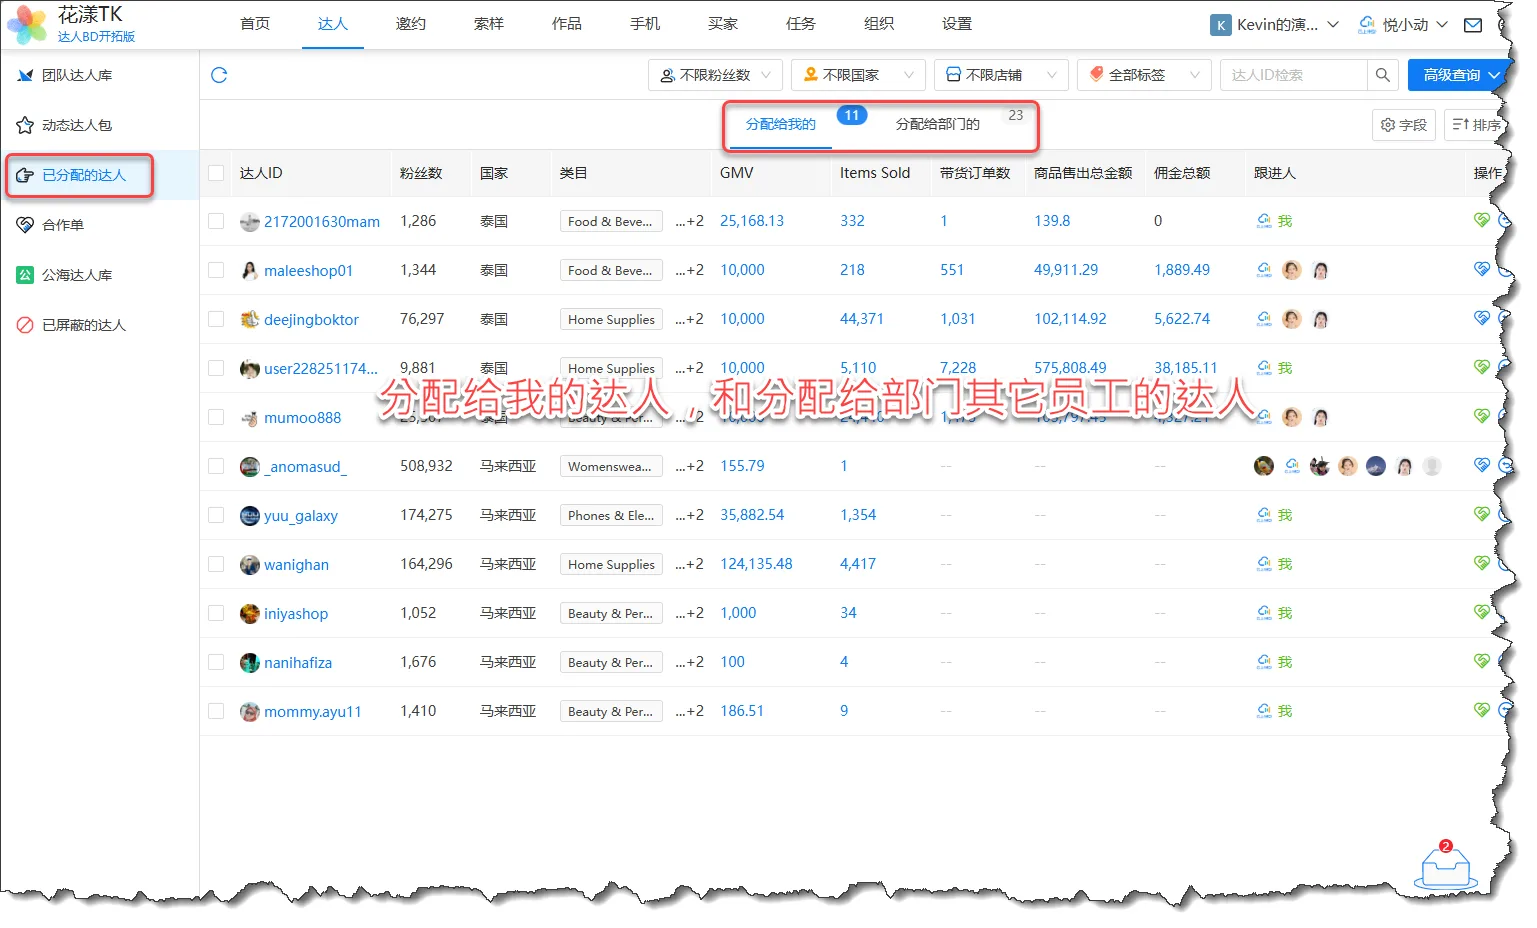
View assigned creators - 4.3
Step 3: Create Collaboration Orders
If you chose "Scenario 1: one Creator assigned to one BD at a time" in step 1, you can skip this step. Collaboration orders are the core record of a BD (business development)–creator relationship in HuaYoung TK. They become essential when you adopt "Scenario 2: one Creator assigned to multiple BDs". A collaboration order records four dimensions: creator, BD, product, and collaboration period. With it, you can accurately trace the BD–creator history and feed downstream performance stats. For assigned creators, BDs can create collaboration orders themselves, adding collaboration products, sample requests, and offline investment details.If you selectedScenario 1: one Creator assigned to one BD at a time, you can skip this step.
4.3.1 What is a collaboration order?
A collaboration order is the core record of a BD (business development)–Creator relationship in HuaYoung TK.
When you adoptScenario 2: one Creator assigned to multiple BDs, split by product, collaboration orders are essential.
Compared with Scenario 1, where one BD owns all products for a Creator during the assigned collaboration period, Scenario 2 uses collaboration orders to record and attribute performance byCreator, BD, product, and collaboration periodacross flexible business cases. For example, multiple BDs can follow one Creator for different products, while cross-month handover remains clear and traceable.
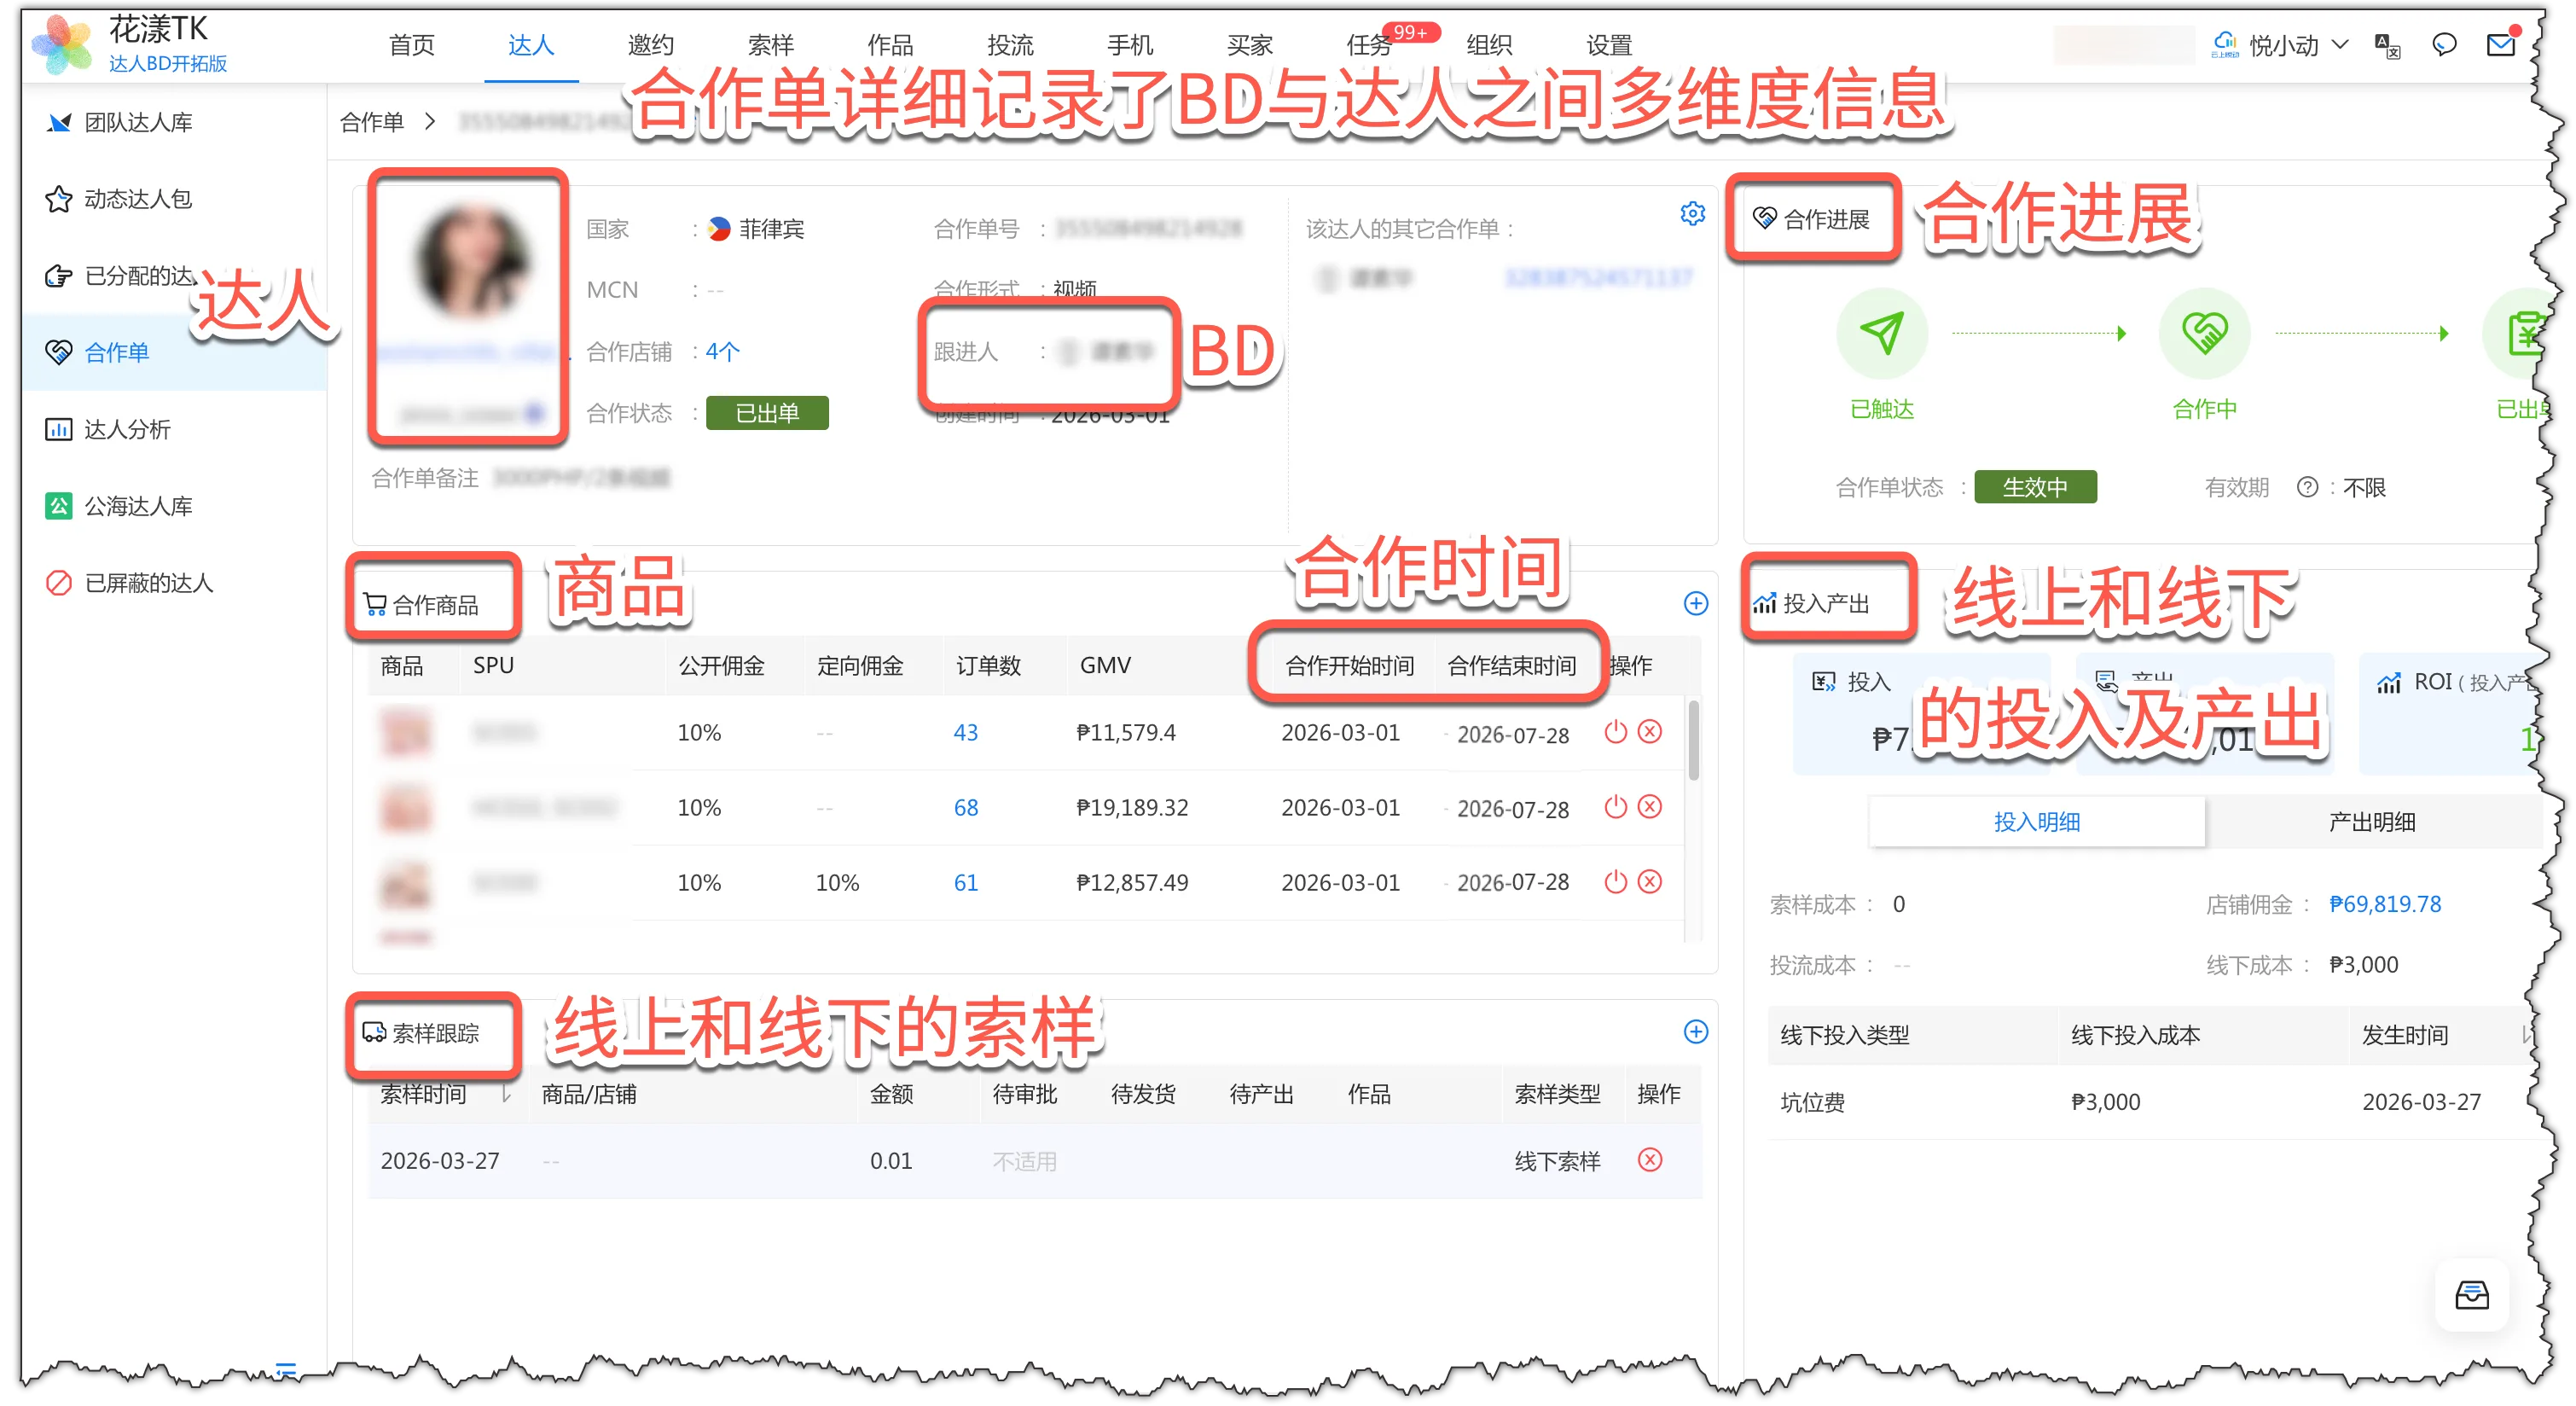
Collaboration-order details Collaboration orders provide a traceable history for downstream performance reporting.
4.3.2 Create a collaboration order
For assigned creators, BDs can create collaboration orders and add collaboration products, sample records, and offline-investment details.
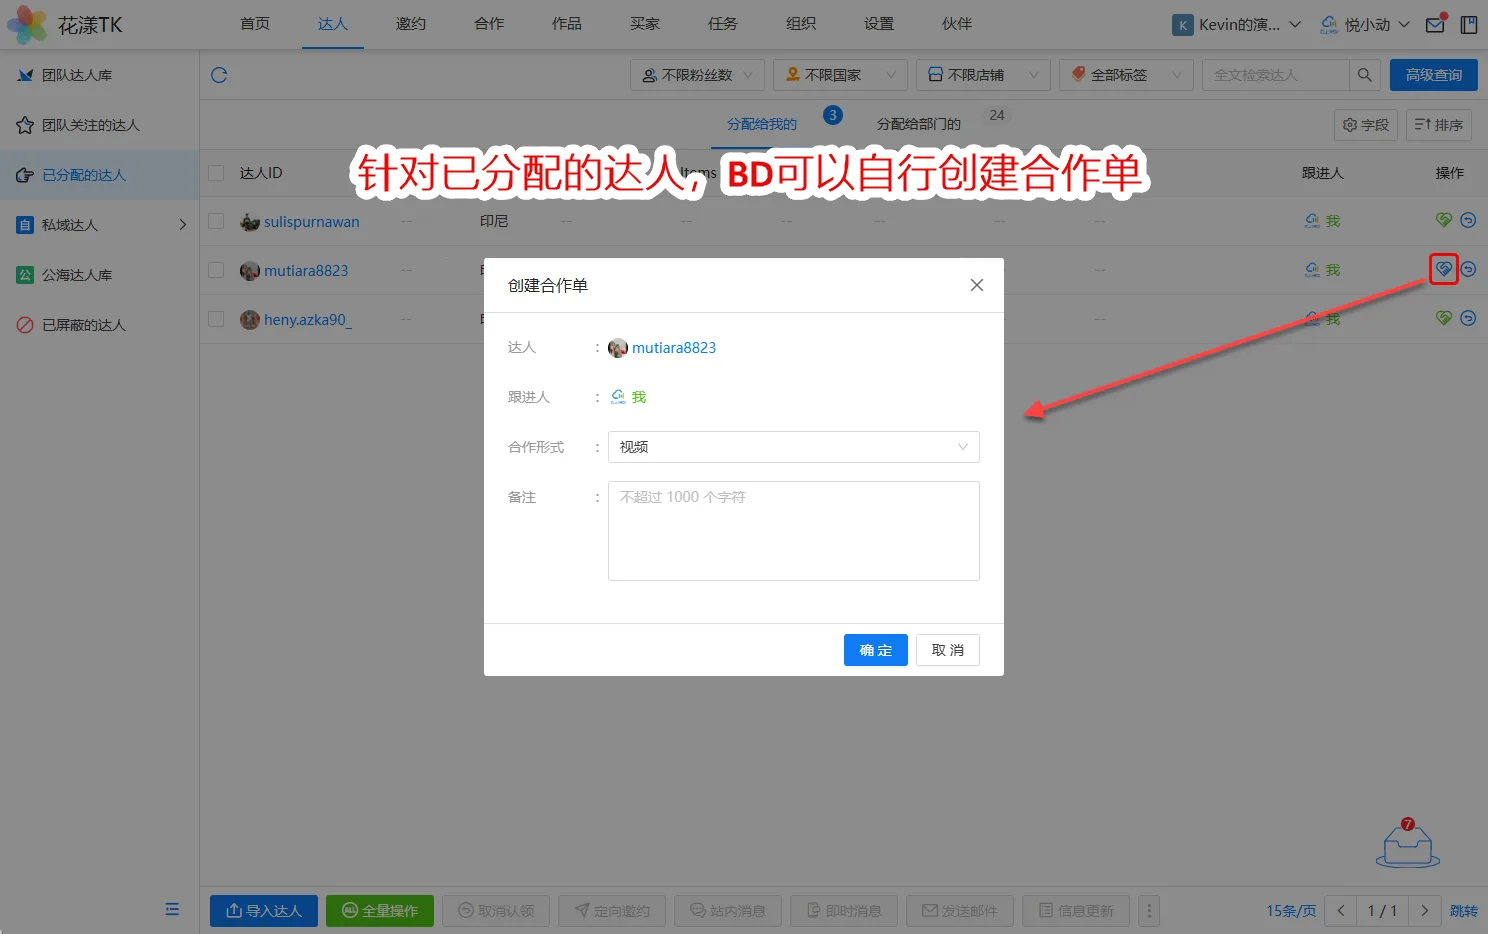
Create a collaboration order 4.3.3 Approve collaboration orders
Configure departmental or company approval and other order settings in Advanced Settings under Creator Claim and Assignment.
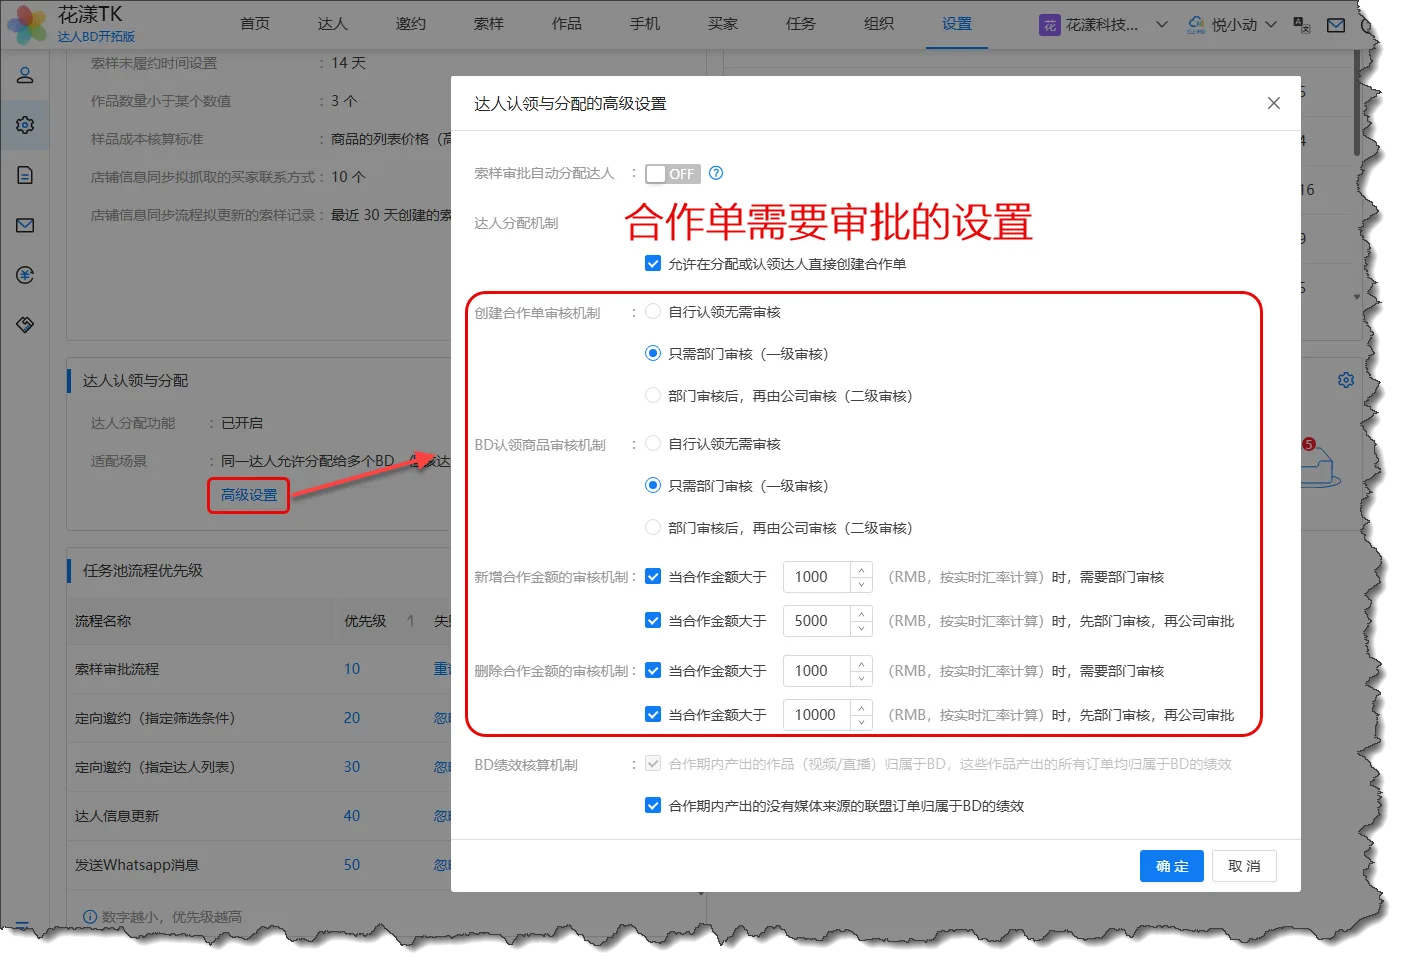
Collaboration-order approval settings When approval is enabled, departmental requests go to managers in the current department and company requests go to BOSS roles, including super administrators.
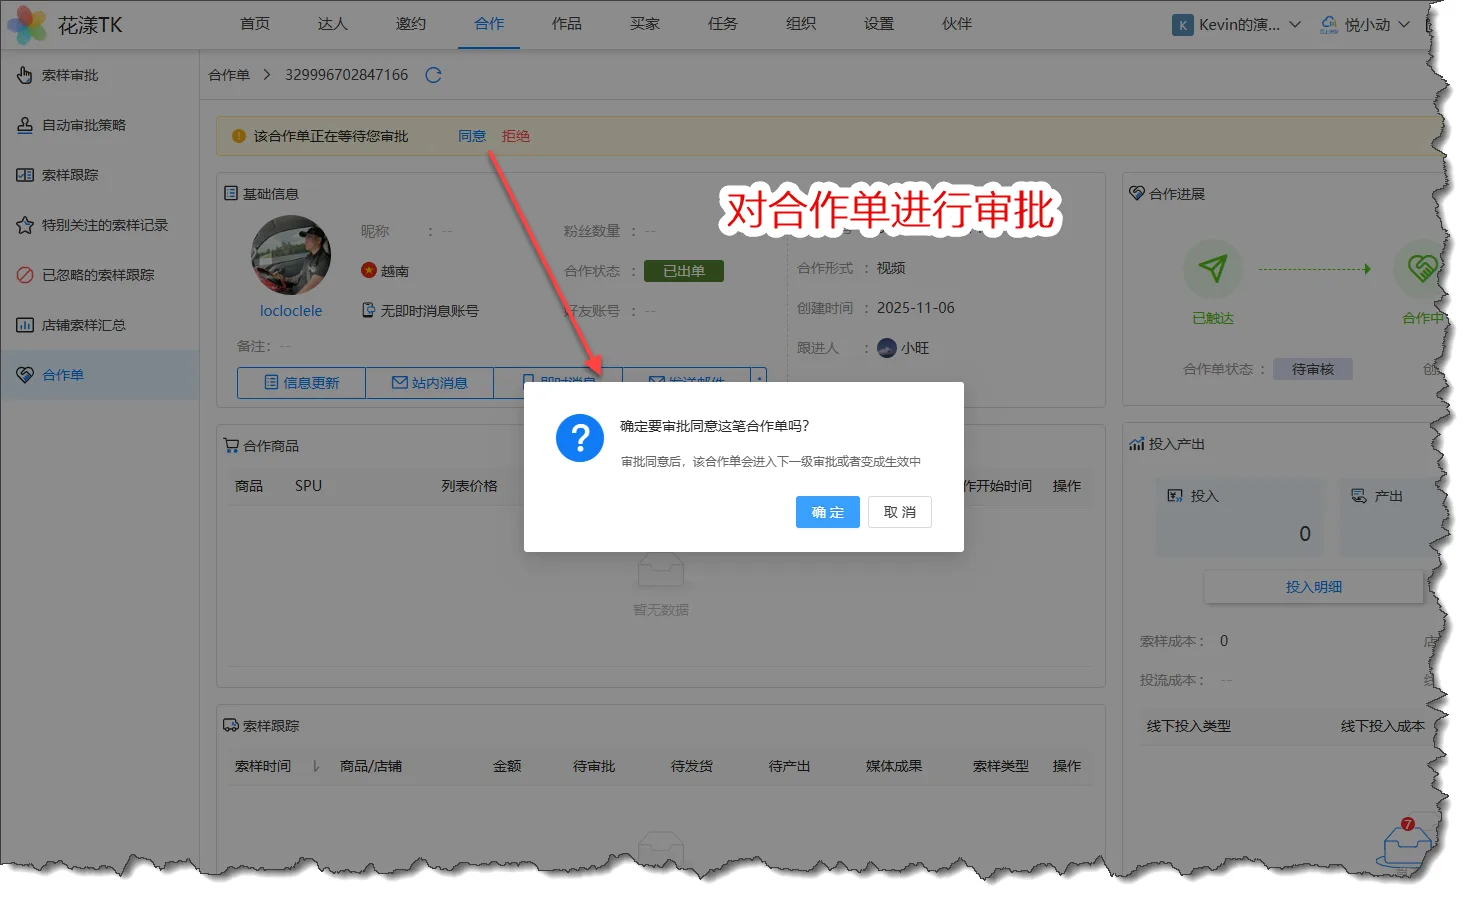
Approve a collaboration order For deeper guidance on collaboration orders and BD–Creator collaboration, see the reference document:Creator–BD collaboration (collaboration orders)
- 4.4
Step 4: View BD Performance
In Organization, open BD Performance to see, by month, each BD's creator outreach, sample delivery, content output, and ROI.4.4.1 Scenario 1: one Creator assigned to one BD at a time
This model calculates BD performance from a single-owner relationship. It tracks each BD’s assigned creators through outreach, sample requests, shipments, fulfillment, first-order creators, samples, videos, and livestreams. GMV, total investment, and ROI are aggregated across the creators assigned to that BD.
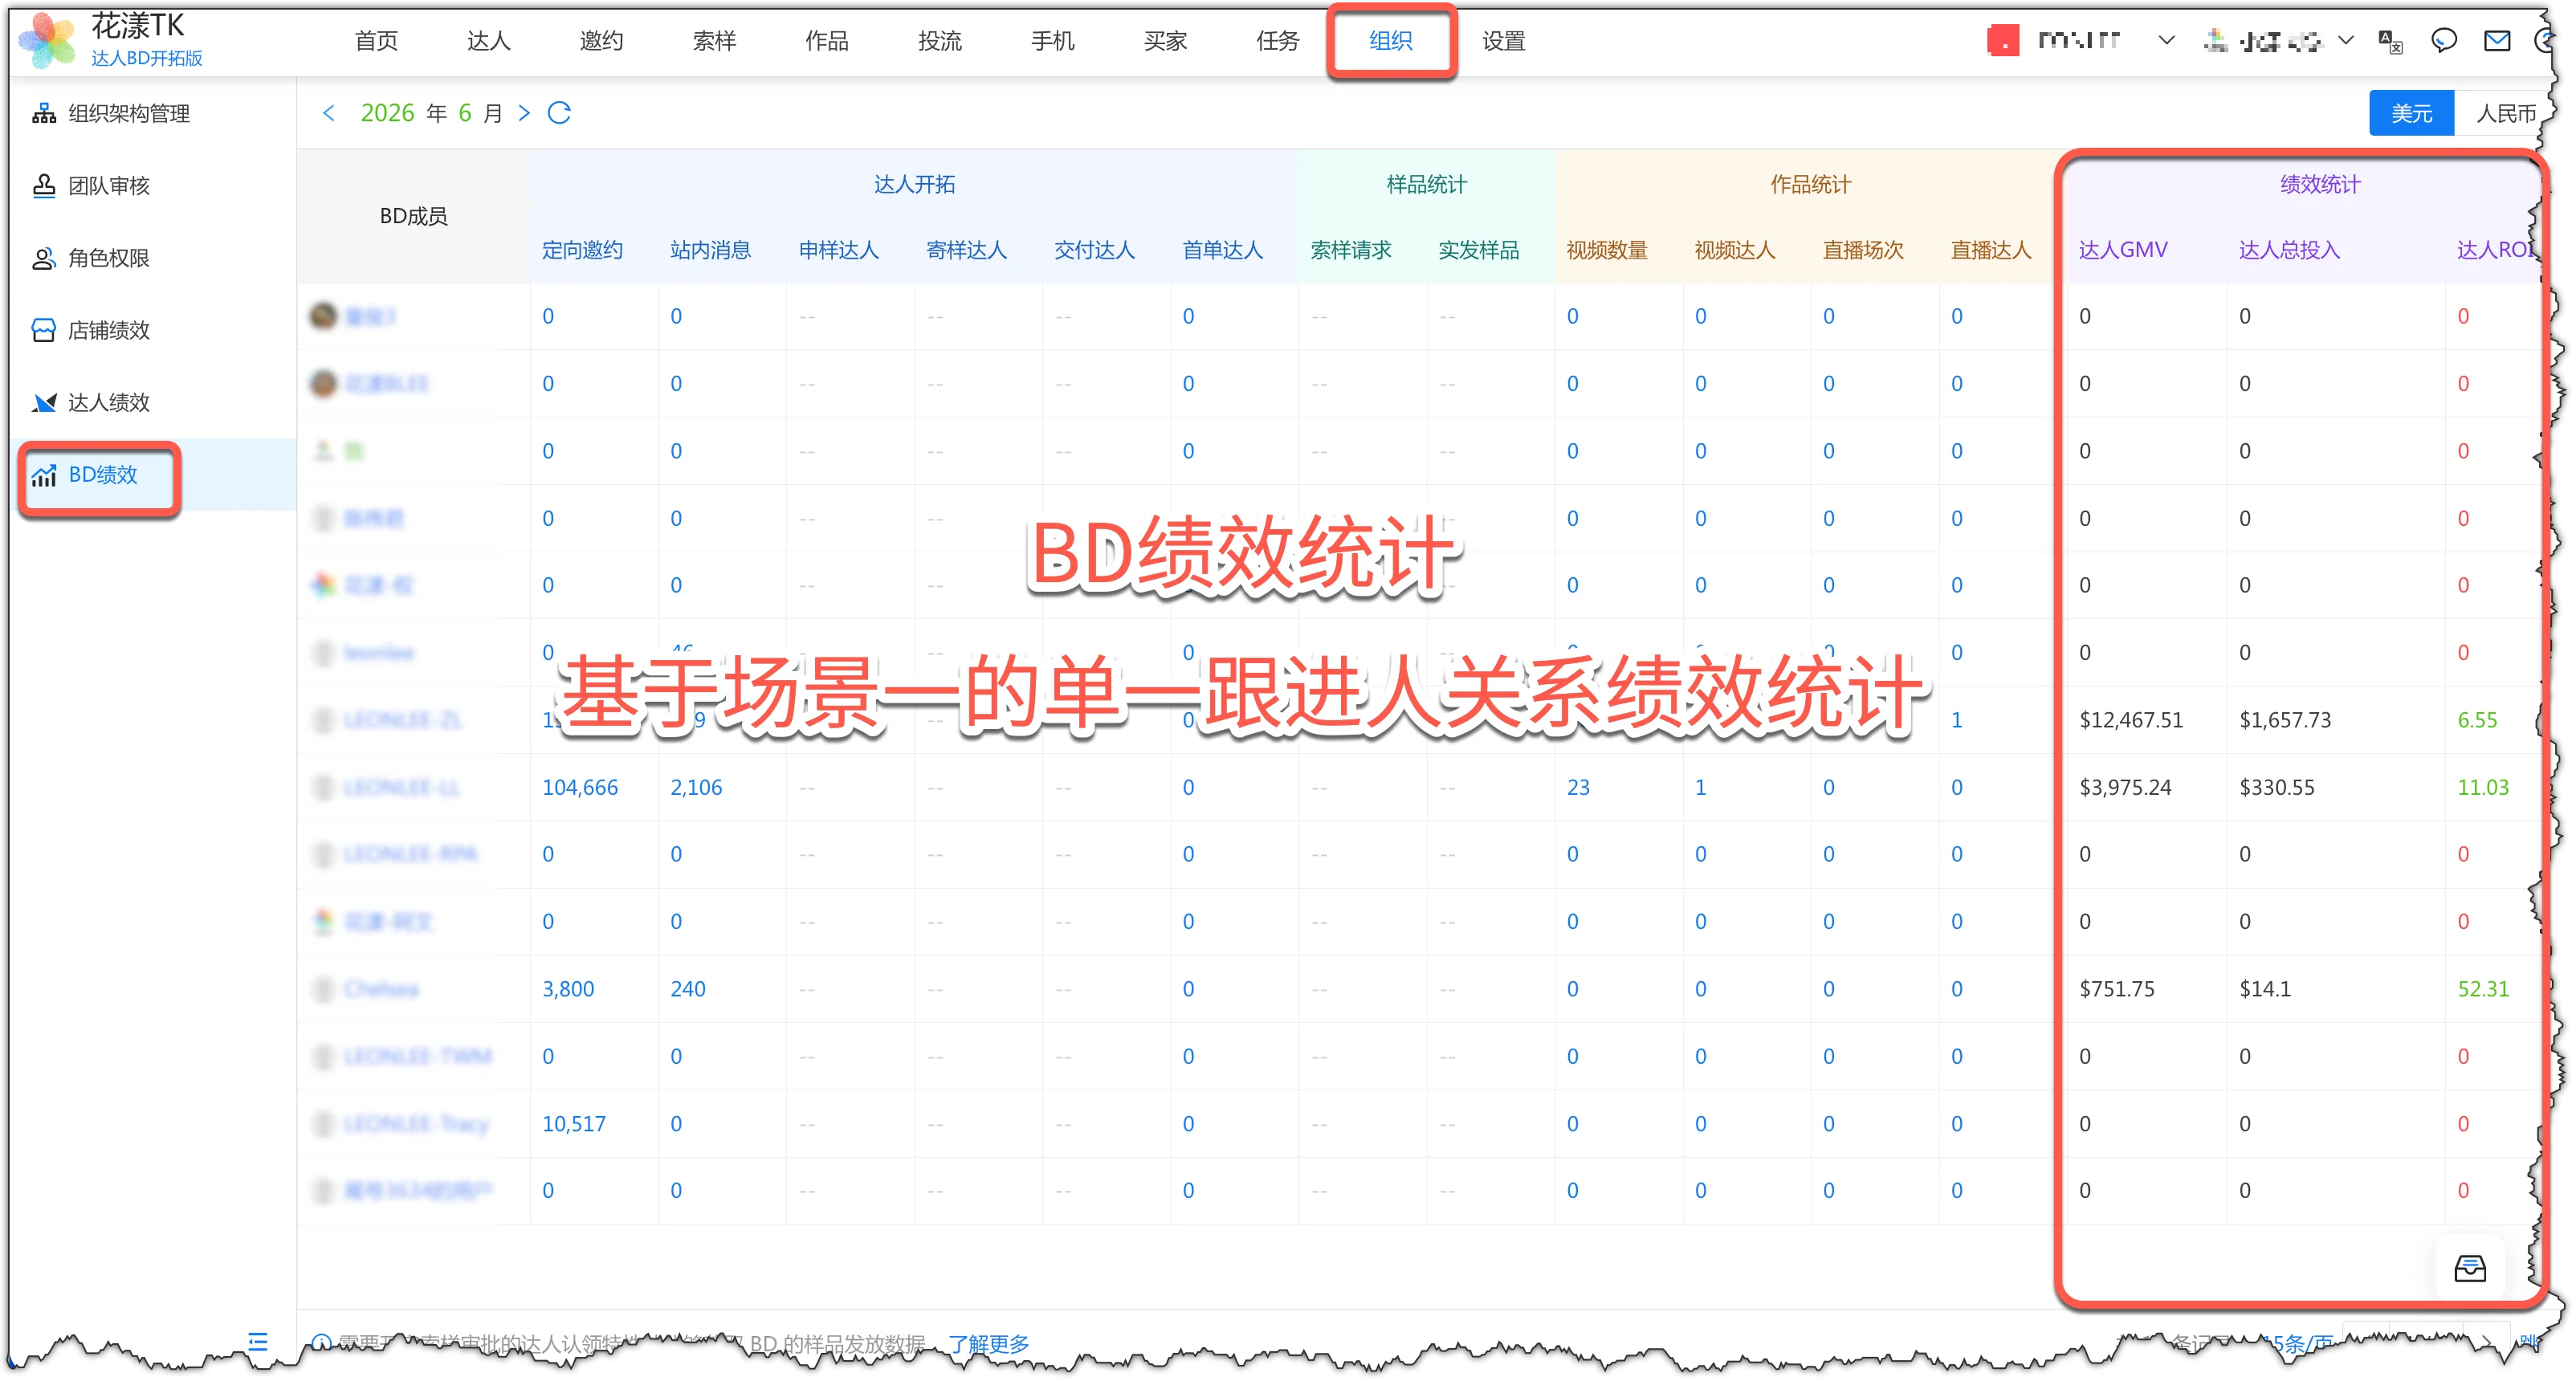
Review creator outreach and BD spend-output 4.4.2 Scenario 2: one Creator assigned to multiple BDs by product
This model calculates BD performance from collaboration orders. It tracks creator outreach, sample delivery, and content output for each order, then aggregates only the GMV, total investment, and ROI explicitly attributed to that BD’s orders. Results from the same Creator’s orders with other BDs are excluded.
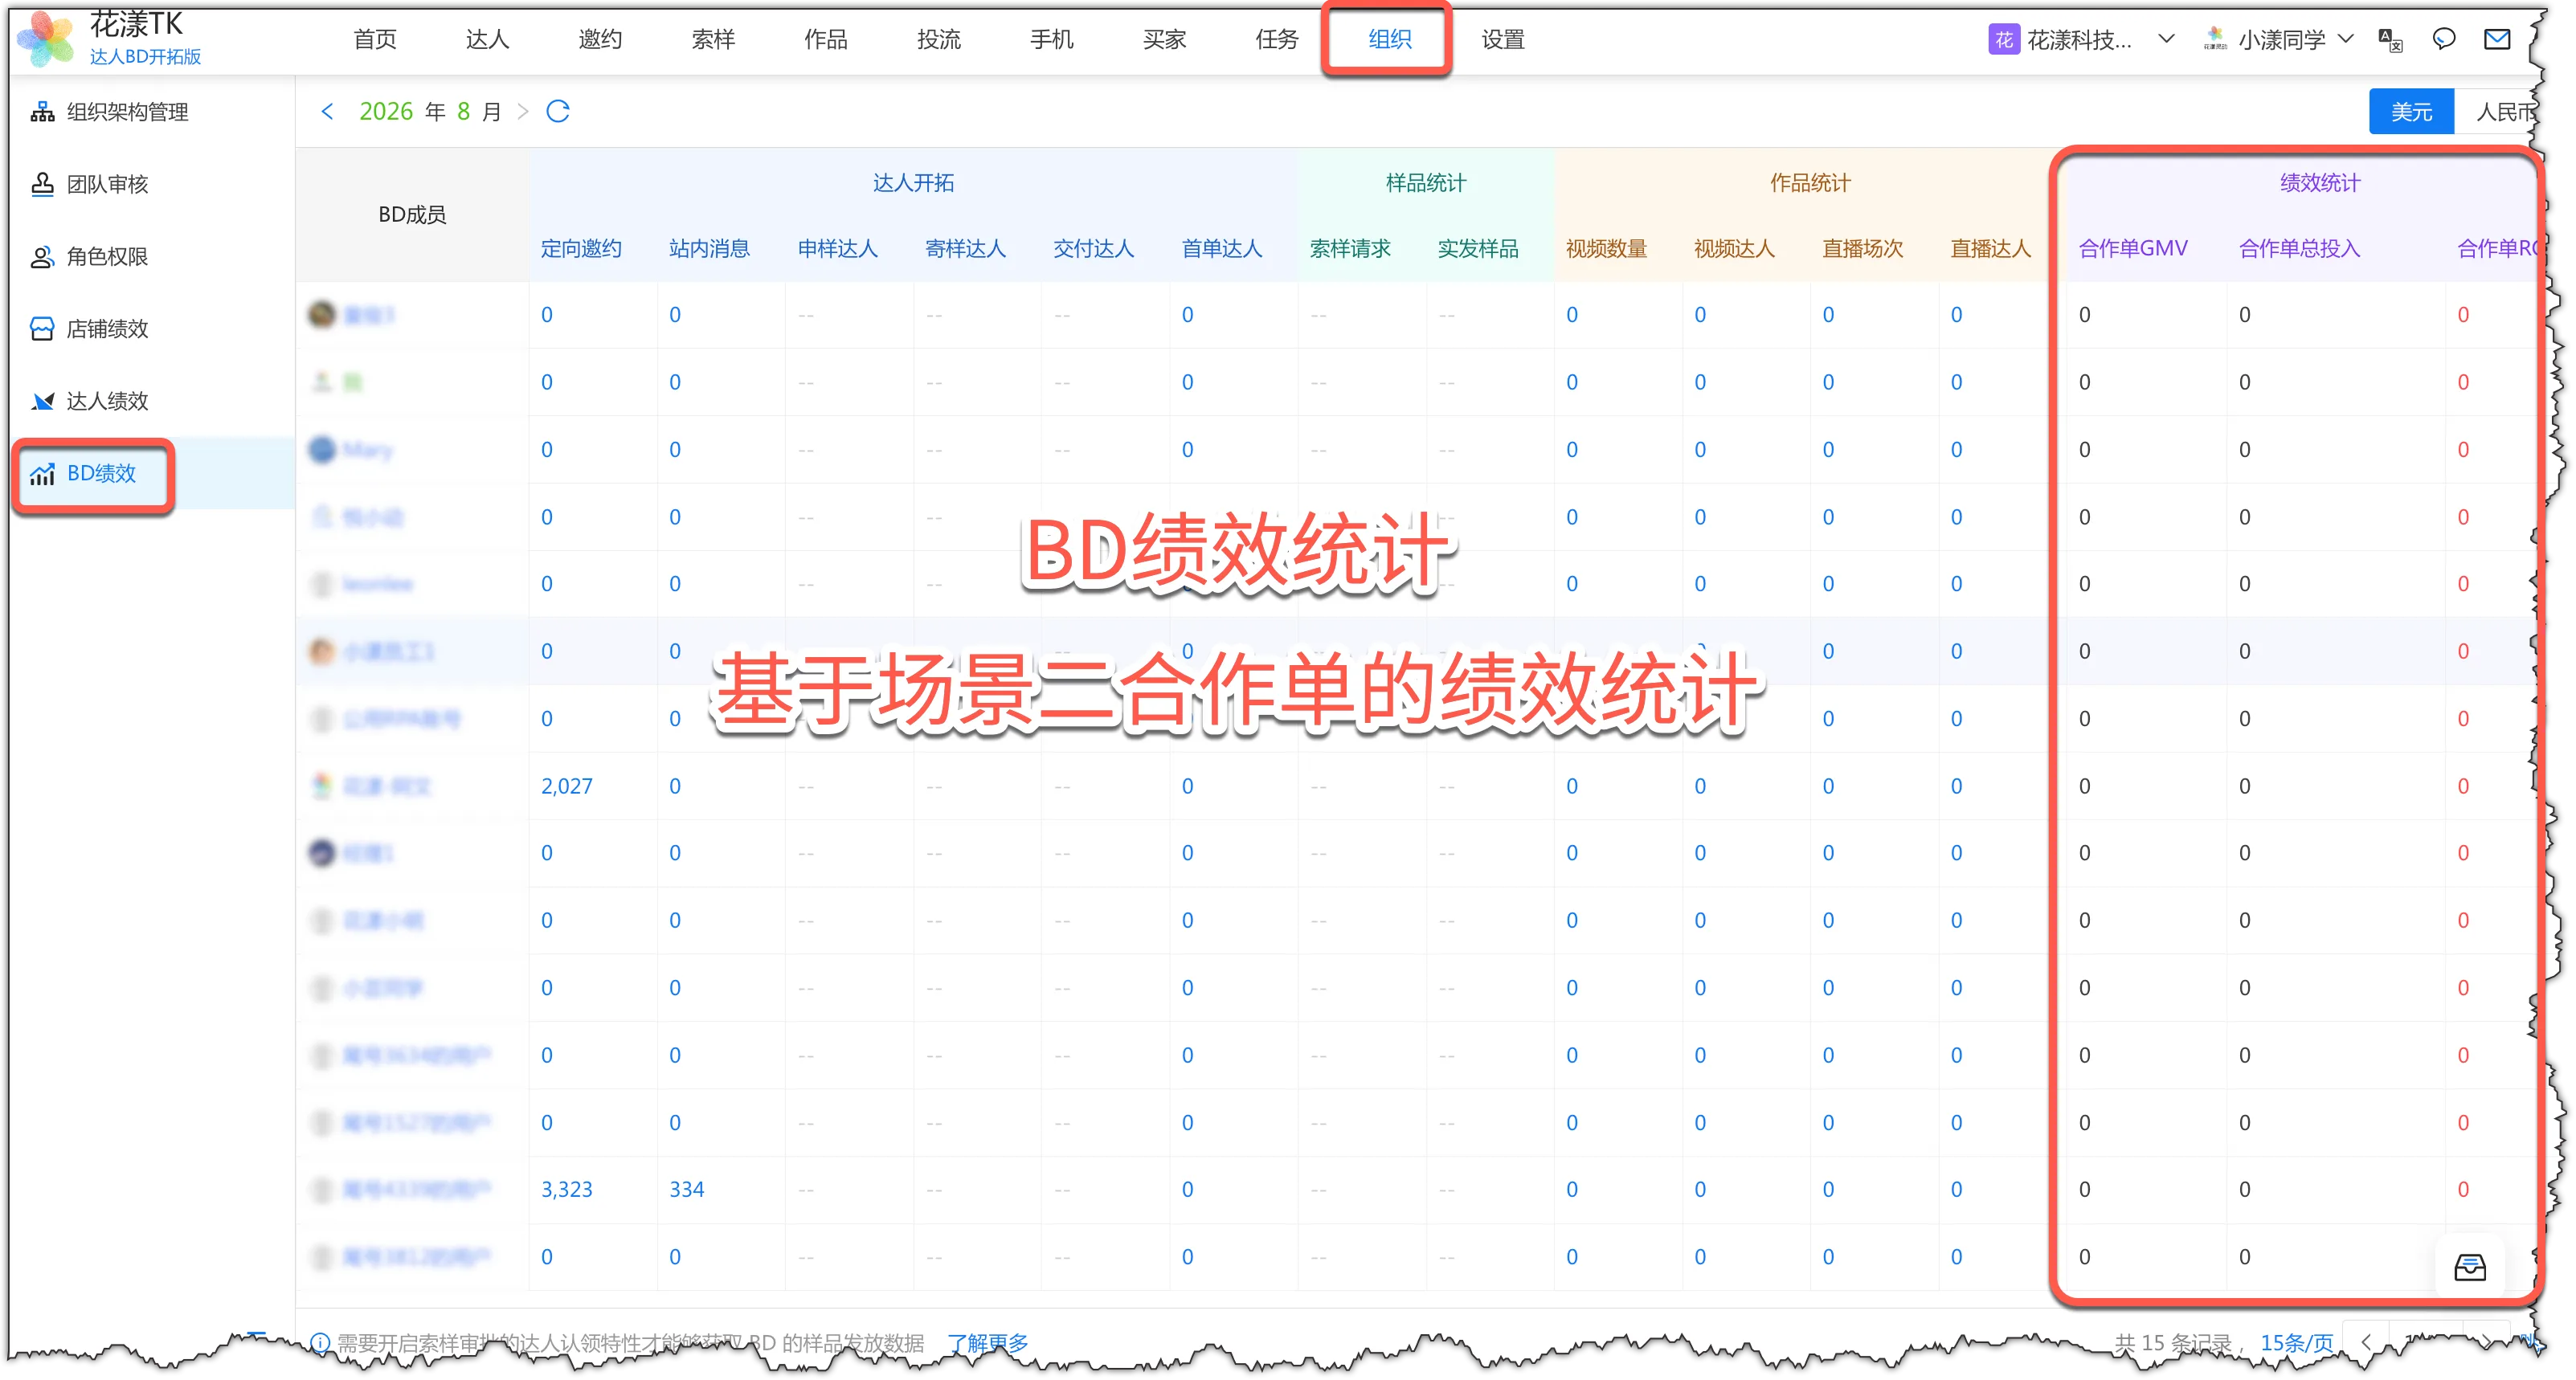
Review creator outreach and collaboration-order ROI For deeper guidance on Creator–BD performance management, see the reference document:Creator and BD performance management